Ballgown up and down regulated genes
2
1
Entering edit mode
@psbpedrobarbosa-9544
Last seen 4.6 years ago

Hi,

I would like to know if it's possible to distinguish between up and down regulated feature after running the stattest function in the ballgown package. In the github page refers to this "For two- and multi-group comparisons, a significant result indicates that the feature is differentially expressed in at least one of the groups", but i'm interested to know in which of the groups the feature is over or under expressed. The displayed fold change values are always positive, so i'm wondering if it's possible to extract this kind of information with this package.


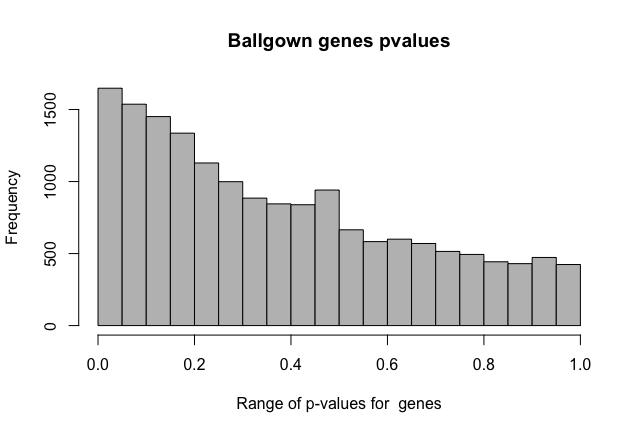
Furthermore, FDR values seem weird, as in all the features with pvalue < 0.05 there isn't any with qvalue < 0.05 too. Why does this happen? Does it has something to do with the statistical model employed in ballgown?

Number of significant features:

> sum(bgresults_c1c3$pval < 0.05, na.rm = TRUE)
[1] 2759

Subset with signigicant features:

> subset <- subset(bgresults_c1c3, bgresults_c1c3$pval<0.05, na.rm=TRUE)

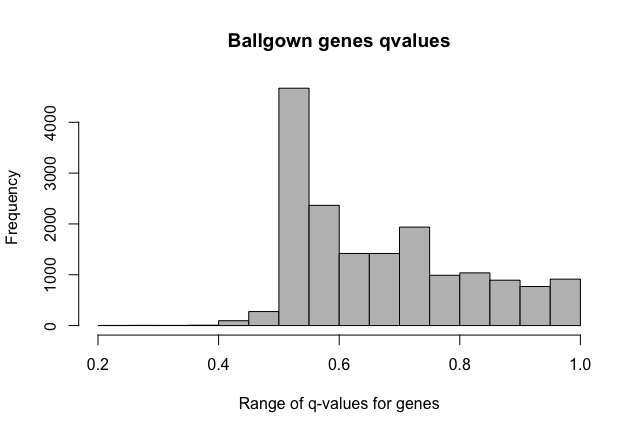
Histogram of qvalues:

> hist(subset$qval, main='Ballgown q-values: c1-c3 comparison', col="grey", xlab='Range of q-values for the more significant transcripts')

qvalues

Thanks in advance,

Pedro Barbosa

ballgown differential expression • 6.5k views
ADD COMMENT
2
Entering edit mode
Alyssa Frazee ▴ 210
@alyssa-frazee-6710
Last seen 3.4 years ago
San Francisco, CA, USA

Are you doing two-group or multi-group comparisons? 

If you are doing two-group comparisons, you can use the `getFC` option in stattest to get the estimated fold change, which indicates direction. (fold change < 1 indicates downregulation, fold change > 1 indicates upregulation, and the reference group is determined by whatever category from your `group` variable the `lm` function in R would consider the reference category. Generally this is the category that comes first alphabetically. If you used 0/1 labels, the reference category will be category 0, so FC > 1 means upregulated in the 1 group.)

If you are doing multigroup comparisons, there is not an automated way to identify which category is causing the statistical significance. It might be useful to make your own plots for this, if it would be useful. (This situation is similar to ANOVA - a significant one-way ANOVA result does not give any information about which sample mean is driving the statistically significant result). 

As for the p-value and q-value distribution, it generally depends on how strong of a signal there is in your data, and having p-values less than 0.05 does not mean there will necessarily be small q-values in the data set after FDR correction (especially if there isn't a really strong signal in your data set). The statistical model is well-understood and is based on nested linear model comparisons, so it should perform accurately, but if you find problems please let us know. You can read more about the statistical model in our paper: http://biorxiv.org/content/early/2014/09/05/003665 -- the paper also contains several examples that show the statistical model to be performing reasonably in data sets with known signal.

ADD COMMENT
0
Entering edit mode

I'm doing two-group comparisons. Thanks about the fold change clarification. I expected fold changes to be outputted as the log2 function (as edgeR, DESeq2) so i would have negative values for the down regulated features.

I did read the paper, but biology is my background, so i've been in trouble to understand what nested llinear models mean in this context. What i observe is when i do multi-group comparisons the range of q-values is more acceptable, but i'm not interested on this type of results. Since the signal might not be strong, should i rely in counting methods rather than estimated abundances ?

Another issue relates to the gene expression calculation. Sometimes i get this following error, am i doing something wrong ?

> bgresults_genes <- stattest(gown=bg,  meas="FPKM",covariate="group", feature="gene", getFC = TRUE)
Error in solve.default(t(mod) %*% mod) : 
  system is computationally singular: reciprocal condition number = 5.61945e-17
ADD REPLY
0
Entering edit mode

Hi Alyssa,

I just have started to use Ballgown and R. I have some questions for you:

1) How is it possible to make multiple comparisons (I have 4 different treatments);

2) How does the program identify the replicates?

3) how can I use the  ≥tFC in stattest?

Thank you,

Isadora

ADD REPLY
0
Entering edit mode
kapeelc • 0
@kapeelc-12567
Last seen 7.0 years ago

Hi,

I am having similar issue with regard to p-value and q-value distribution. I am doing a pariwise comparison. I do not see any genes differentially expression for q value < 0.05. I ran the same comparison using DESeq2 and Cuffdiff I see 1865(padj < 0.05) and 1429(q < 0.05) respectively. I followed the protocol listed for ballgown in the paper,  below are the p value distribution and q value distribution for the comparison.


P value

q value

Any clues why the q value so high. 

Thanks

Kapeel

ADD COMMENT
0
Entering edit mode

How many replicated do you have per group? I had similar problem when I had 2 replicates per group; but increasing it to 3 solved the problem. 

ADD REPLY

Login before adding your answer.

Traffic: 743 users visited in the last hour
Help About
FAQ
Access RSS
API
Stats

Use of this site constitutes acceptance of our User Agreement and Privacy Policy.

Powered by the version 2.3.6