
Hi all,
I am currently testing WGCNA on proteomic datasets and I have an issue regarding the soft-thresholding power curve.
I have a good number of samples (85), coming from 3 different organs, each at different developpement stages (5 replicates per stage).
A mass spectrometry was performed, giving a spectral count for each protein detected in each sample. At the end, 1888 proteins were detected among all samples, although a high number of missing values are present.
I first removed 4 low coverage samples containing a lot of missing values.
Then, I tried to choose the best power to set for further analysis using the scale free topology model fit.
However, above a power of 22, the fit drops (the curve does not level off as expected). I have often seen this (on this example : above 14, or this one : above 16 (fig. C)) but never found an explanation.
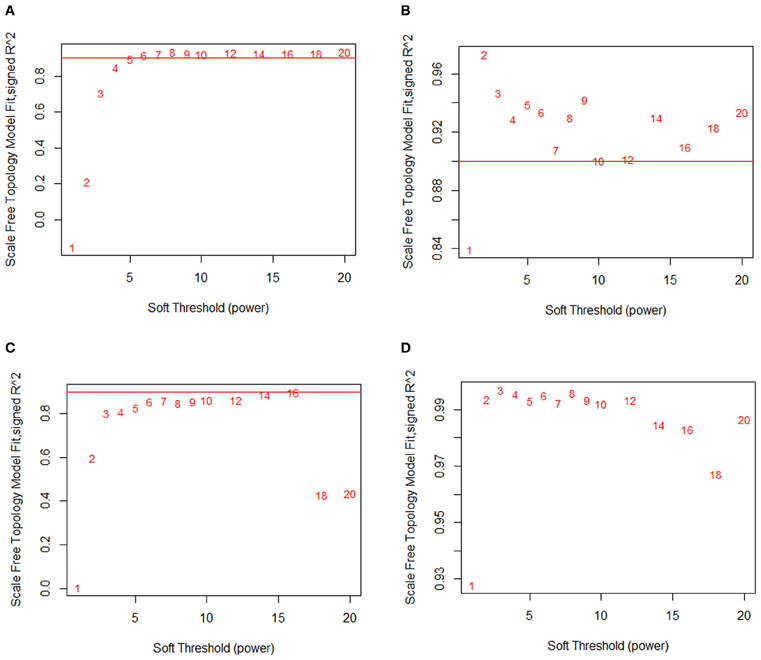
Can I choose a suitable power with this dataset without getting wrong results ?
Why is there a drop with high power ?
Thank you for help