ATACseqQC: a few questions
1
0
Entering edit mode
@davidmckinnon-16330
Last seen 5.8 years ago

I have a few questions related to this package, which has generally worked well and is an easy way to perform preliminary analysis of ATAC-seq data.

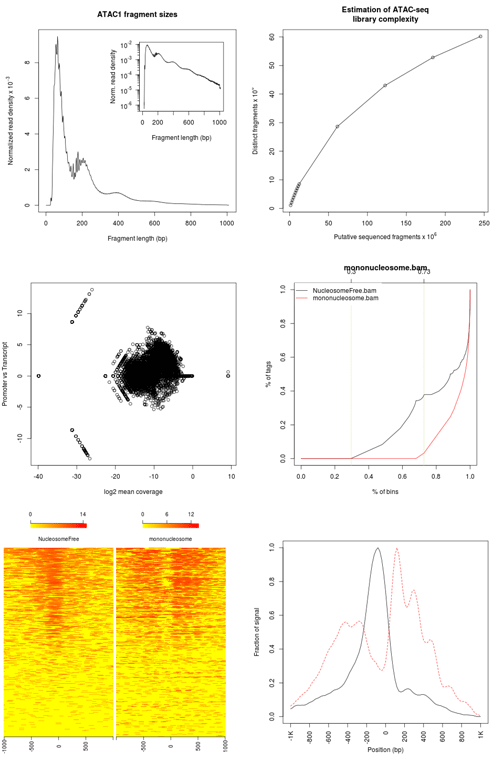
1. I do not understand the output from the  cumulativePercentage  function described in the vignette. The plot shown in the vignette is very different from what we saw using our data. Otherwise our data look similar to the data described in the paper (see image below). 

2. Is it possible to get a Transcription Start Site (TSS) Enrichment Score from your program? This measure is described here: https://www.encodeproject.org/data-standards/terms/#enrichment

Ultimately, I would like to submit our data to Encode so it would be useful to check that it passes their criteria.

ATACseqQC • 1.0k views
ADD COMMENT
0
Entering edit mode
Julie Zhu ★ 4.3k
@julie-zhu-3596
Last seen 5 months ago
United States
David, Thanks for the feedback! Regarding the output from cumulativePercentage, you are unlikely to get a plot that looks exactly the same as the one shown in the vignette. The further away from the y = x line the curve is, the higher the signal noise ratio is. We will add the Transcription Start Site (TSS) Enrichment Score later ( https://www.encodeproject.org/data-standards/terms/#enrichment) Best regards, Julie ________________________________
ADD COMMENT

Login before adding your answer.

Traffic: 706 users visited in the last hour
Help About
FAQ
Access RSS
API
Stats

Use of this site constitutes acceptance of our User Agreement and Privacy Policy.

Powered by the version 2.3.6