
Dear BC community,
I have performed gene set enrichment analysis by using clusterprofiler package. I prepared a gene list by using package vignettes and got everything working, but I'm having a bit of a hard time interpreting the results. I read pretty much all the questions and the vignettes about this package, and can't really find an answer to my question
My analysis approach is the following:
1) Obtain normalized expression matrix from Seurat (rows are genes, columns are individual cells)
2) I gave unique identifiers to cells so that I can subset them depending on the comparisons I'm interested in. For instance day9_wt_T_cell_1/2/3... , day12_wt_ T_cell_1/2/3...
3) Calculate average gene expression from two groups for each gene (ie. day9 and day12 cells of interest)
4) Calculate the ratio of average expression for each gene and export this as a named and sorted numeric vector (which serves as the gene list for clusterprofiler functions. This vector contains all the genes that were in the expression matrix to start with, so there is no filtering for significantly altered genes. Also the sorting order is descending ratio of KO/WT, meaning higher numeric data associate with higher fold expression in KO samples.
5) Perform enricher analysis with this list and MSigDB pathways.
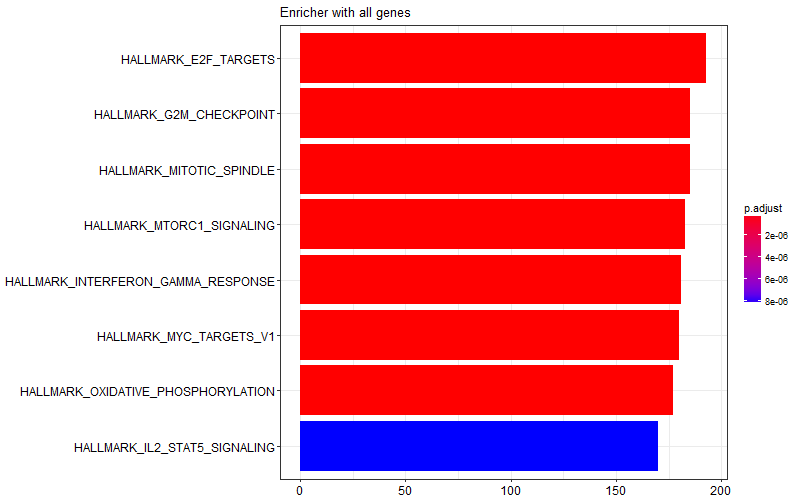
I obtained the following image with the whole gene list provided to enricher function. I'm not sure which of these are enriched in WT vs KO samples.

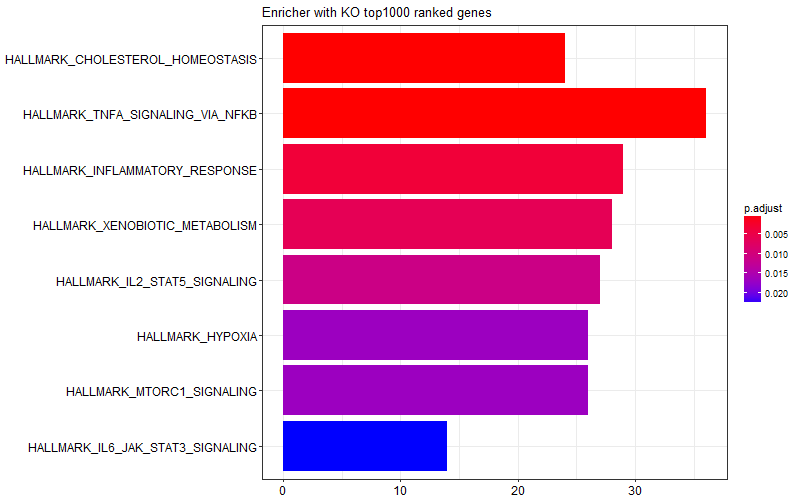
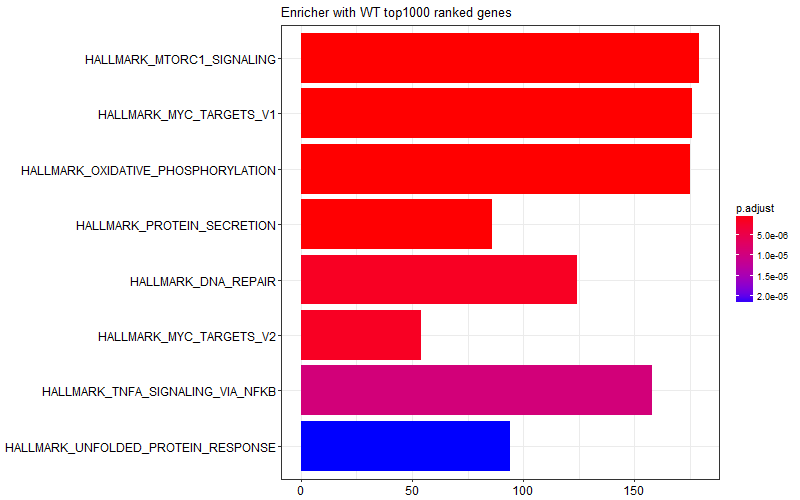
I was curious and I tried limiting the gene list I provided to the enricher function only to top 1000 genes (induced in KO) or bottom 1000 genes (induced in WT). I got the following two figures suggesting some of the enrichment scores in the graph above is come from WT samples, and some other come from KO samples.
This is the snipped of code I use:
msig_HALLMARK <- read.gmt("../msigdb_genelists/h.all.v6.2.symbols.gmt")

# I created a rank_generator function to extract relevant columns from the expression matrix

f480_d12_KOvsWT_list <- rank_generator(exprs = exprs, marker1 = "ADGRE1" ,marker2 = NULL,
                               ref_id1 = "d12wt",ref_id2 = NULL,
                               samp_id1 = "d12ko",samp_id2 = NULL)


all<- enricher(names(f480_d12_KOvsWT_list),
              TERM2GENE = msig_HALLMARK, qvalueCutoff = 0.05)
f480_d12_KO_enrichment <- enricher(names(f480_d12_KOvsWT_list)[1:1000],
                                   TERM2GENE = msig_HALLMARK, qvalueCutoff = 0.05)

f480_d12_WT_enrichment <- enricher(names(f480_d12_KOvsWT_list)[length(f480_d12_KOvsWT_list)-1000:length(f480_d12_KOvsWT_list)],
                                   TERM2GENE = msig_HALLMARK, qvalueCutoff = 0.05)

png("enrichment_ko_genes.png", width = 800, height = 500 )
barplot(f480_d12_KO_enrichment, title = "Enricher with KO top1000 ranked genes")
dev.off()

png("enrichment_wt_genes.png", width = 800, height = 500 )
barplot(f480_d12_WT_enrichment, title = "Enricher with WT top1000 ranked genes")
dev.off()
I think my question is, simply, how can I get the enrichment scores for two groups I'm comparing separately to describe the changes in my experiment. Am I missing something here? I also tried clusterprofiler::GSEA no term enrichced under specific pvalueCutoff).
Thank you very much for your insights!
Best,
Atakan

Thanks for your message, but I'm not sure if it resolves my question. I can visualize the results as a data frame or in the form of a graph, but the results inherently don't show which gene sets are enriched in one vs the other phenotype. What I'm looking for is something equivalent to positive and negative enrichment scores (i.e. indicative of enrichment in condition 1 vs condition 2 respectively).
I can think of a way to get around this by simply reversing the order of the ranked gene list. But if I was to use the whole gene set (~11k ranked genes) reversing the order won't change the gene names to be used in the enrichment analyses. Maybe creating a top 1000 ranked gene cutoff might help but this number is rather arbitrary. I hope my point makes sense here.
Best,
Atakan