Entering edit mode

jonathan.limwc
•
0
@jonathanlimwc-19284
Last seen 5.3 years ago
Hi all,
First off, I'm a wet lab scientist learning to analyse my own data. I've design my experiment as such
> coldata
    sample        condition litter
1 KO1_sort.bam        KO      A
2 KO2_sort.bam        KO      B
3 KO3_sort.bam        KO      A
4 KO4_sort.bam        KO      B
5 WT1_sort.bam        WT      A
6 WT2_sort.bam        WT      B
7 WT3_sort.bam        WT      A
8 WT4_sort.bam        WT      B
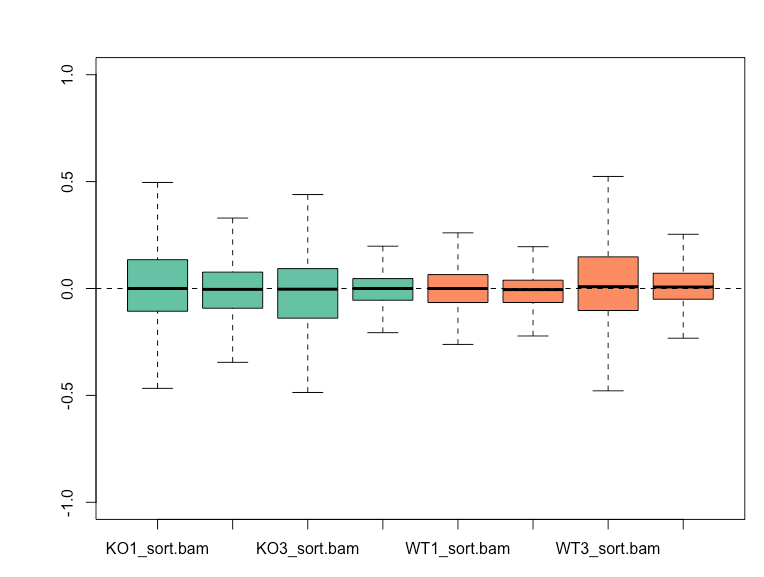
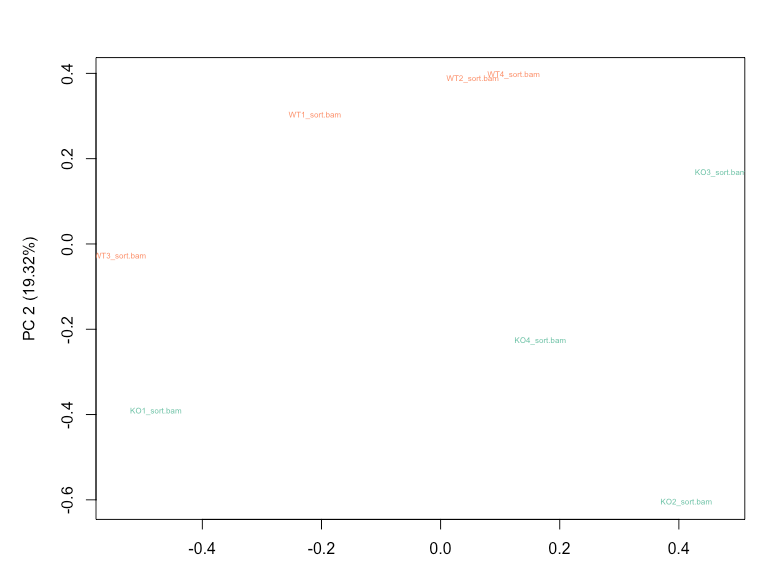
Before normalization, WT3 and KO1 shows higher variability from the RLE plot, and also cluster together based on the first principal component on my PCA plot.
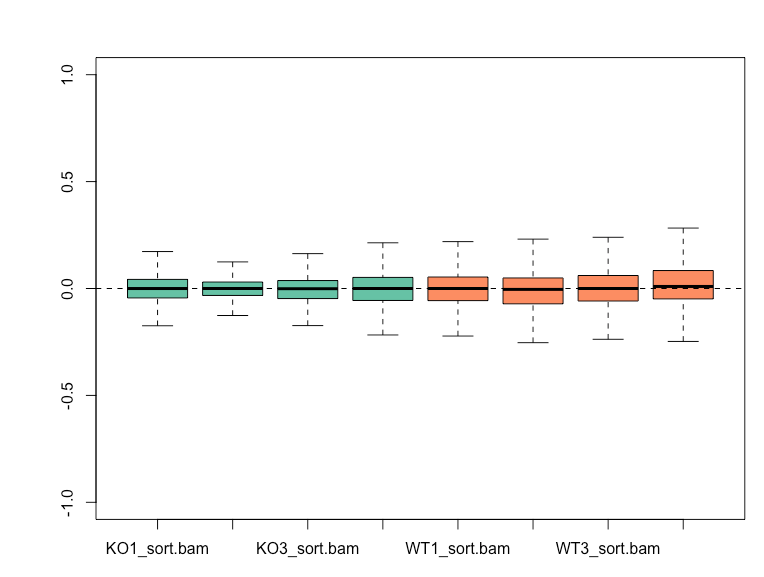
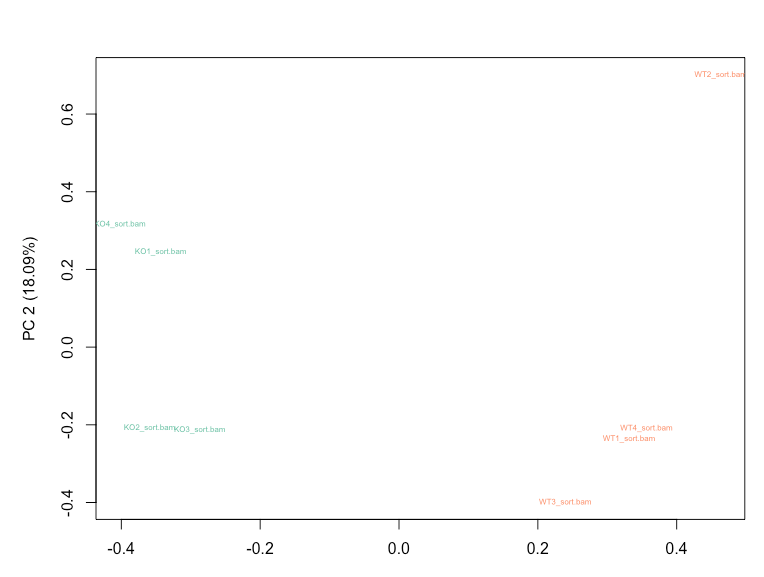
RUVg with k=2 is able to reduce the variation seen in the RLE plot and results in WT and KO samples clustering separately on PCA plot.
Empirical genes for RUVg were obtained using a cutoff of pvalue > 0.5 and design = ~ litter + condition in DESeq2. My question is whether I should still account for the 'litter' factor in my DESeq2 design after taking into account the variation modelled using RUVg, or not? Option 1:
design(ddsruv) <- ~W1 + W2 + litter + condition
Option 2:
design(ddsruv) <- ~W1 + W2 + condition
Thank you!
