Bioconductor - Karyoploter | Visualization | Multiple Chromosome display issue
1
0
Entering edit mode
@saeed-ur-rehman-20580
Last seen 5.0 years ago
Pakistan/ICT/CUI

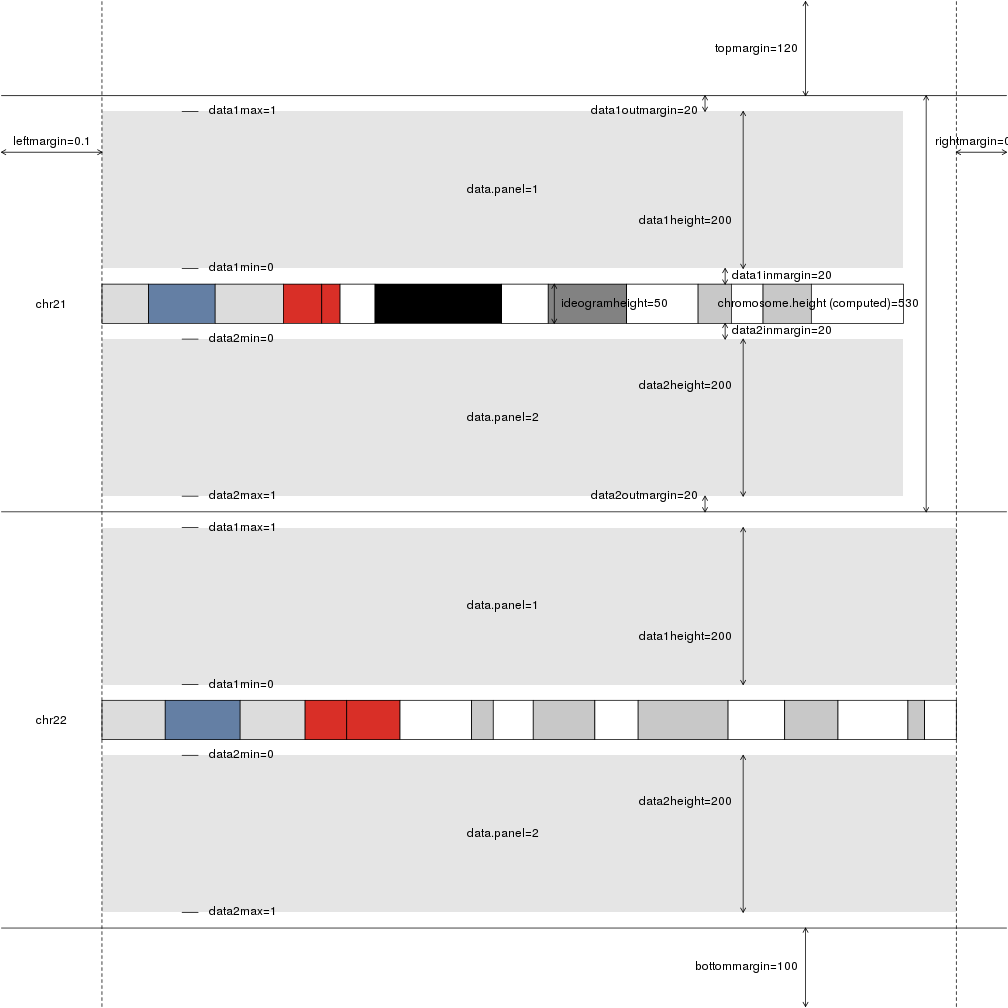
How can I increase the distance between the chromosomes plotted? when all the chromosomes are plotted with their data backgrounds ?

currently everything is so jam packed that no analysis can be done.

karyoploteR • 842 views
ADD COMMENT
0
Entering edit mode
bernatgel ▴ 150
@bernatgel-7226
Last seen 3 months ago
Spain

Hi Saeed,

You can change the distance between chromosomes as well as the height of the ideogram or the data panels using the "plot.params" argument in plotKaryotype.

In your case you'll probably want to increase the value of data1outmargin but there are many different parameters to adjust. You can see them all calling plotDefaultPlotParams and giving it the plot type you are using. For example, for plot type 2 you would get something like this.

enter image description here

This function can even receive a plot.params object and it will adjust itself to plot the given parameters to help you understand the plotting process. I've used that many times.

In addition to that, the karyoploteR tutorial has a page dedicated to how to change plotting parameters in karyoploteR where you will find more information.

Oh, and I usually recommend creating big images (at least 1500x1500 or 2000x2000 px pngs). This also helps you get a clearer picture of the data you have.

Hope this helps,

Bernat

ADD COMMENT

Login before adding your answer.

Traffic: 846 users visited in the last hour
Help About
FAQ
Access RSS
API
Stats

Use of this site constitutes acceptance of our User Agreement and Privacy Policy.

Powered by the version 2.3.6