
Hello, I am a computer scientist who is new at analyzing microarray data. So my question may be too easy so I apologize for that. I really need help with that. I got some dataset on GEO (GSE44248) on the human LCL cell line. I want to analyze this data using Limma to find differentially expressed genes. My data are time series and I want to find differentially expressed genes over time. Here is the description of the data:
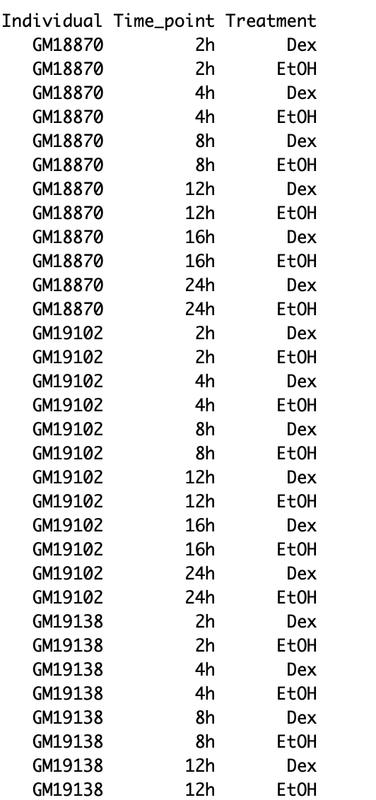
- 8 LCLs samples (Individual in the picture)
- Time points: 2, 4, 8, 12, 16 and 24 hrs -Treatment: Dex vs EtOH (control) -Each sample is either treated with Dex or EtOH so I am in a case of paired-sample.
Here is a snapshot of my data matrix :
My questions are the following:
How can get a good design matrix for Limma to analyze my paired sample time series data ?
I was thinking about this I will use spline for time: b=ns(Timepoint,df=3) : ~ Time_point*Treatment+ Individual
Do you think is a good idea? If not which formula do advice to use if I want to find differentially expressed genes between treated and control sample for at least one time point and across the cell line samples?
Which coefficient should I check in the topTable function ?
Thank you very much in advance.