Entering edit mode

Hello!
I have a question about the results of differential expression analysis in deseq2.
I did:
DEgenes=results(DEcd, contrast=c("clD", "V", "VG"))
and I got the table with the log2 fold change and the p values. But what I didn't understand is to which group the fold change refer to. So if I have a negative log2 fold change, it means that the gene is down-regulated, but in which of the 2 groups of samples? Where can I find this information?
Many thanks
Francesca

Hi Michael,
thanks for your reply. I read both the vignette and the tutorial, but I still didn't find the information I'm looking for.
If I extract the results for a specific contrast, let see A vs B, how can I know if the log2 fold changes are referred to A or B?
A positive log2 fold change for a comparison of A vs B means that gene expression in A is larger in comparison to B.
Here's the section of the vignette
"For a particular gene, a log2 fold change of −1 for condition treated vs untreated means that the treatment induces a change in observed expression level of 2^−1 = 0.5 compared to the untreated condition."
Here's the section of the workflow
"The column log2FoldChange is the effect size estimate. It tells us how much the gene's expression seems to have changed due to treatment with dexamethasone in comparison to untreated samples. This value is reported on a logarithmic scale to base 2: for example, a log2 fold change of 1.5 means that the gene's expression is increased by a multiplicative factor of 2^1.5≈2.82."
Hi Michal
I have a further question. I read I can use the rlog transformation and use those values for heatplots or pca. Do I need to use raw counts as input for rlog or do I need to normalize for library size before (diving the reads for each gene by the total reads of the sample)
thanks!
Always check the documentation first, by typing the function name with a question mark in front:
?rlogThe help file tells you:
"This function transforms the count data to the log2 scale in a way which minimizes differences between samples for rows with small counts, and which normalizes with respect to library size."
The vignette (accessible via
vignette("DESeq2"))section on transformations says:"Both transformations produce transformed data on the log2 scale which has been normalized with respect to library size."
So the rlog function takes care of normalization for library size; you do not provide the rlog with normalized counts or non-integer values.
In plain English ,I have a comparison HSC and LSC where HSC is my control , Im comparing HSC vs LSC , so if the fold change is positive it means the gene is high in HSC ?
If HSC is control, nearly all (perhaps all) R/Bioc packages and analysts would expect you to set HSC as the reference level and report LSC vs HSC (read: log (LSC / HSC) as the LFC. This is also printed at the top of the results table when you print it to console if you follow the guidelines in the vignette on setting factor levels.
Also see the workflow (rnaseqGene package) which explains how to interpret the sign of the LFC.
"would expect you to set HSC as the reference level " yes this i had done . "report LSC vs HSC (read: log (LSC / HSC) as the LFC" thank you for clarifying me in simple words it was bit confusing although i might have ran your library more than 100 times
Hi Michael Love I have confusion regarding the calculation of log2FoldChange. The documentation says log2 fold change for gene i for sample j is given by,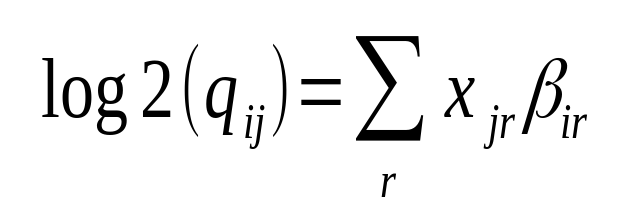
This is specific to a sample j (suppose the treated one). How it is considering the 'control' sample to calculate fold change?
This is not specific to j. As in all generalized linear models the coefficients are calculated by computing the likelihood over all samples (j).
Hi Michael,
I have some doubt in the explanation "A positive log2 fold change for a comparison of A vs B means that gene expression in A is larger in comparison to B.'
Does it have anything to do with alphabetical order of the condition? Like, I have "Reponse" and "Non-response" in my sampledata. How to know if the increased positive fold change is for Response group or no-response group?
Note : I am using Deseq with phyloseq , http://joey711.github.io/phyloseq-extensions/DESeq2.html
Thanks,
Reeba
See this section of the vignette:
https://bioconductor.org/packages/release/bioc/vignettes/DESeq2/inst/doc/DESeq2.html#note-on-factor-levels
There are three ways to know:
You can specify the reference level as in the above link.
You can specify the contrast explicitly when you call results() by using the 'contrast' argument.
Finally, when you print the DESeqResults table, it has the information printed at the top, see here:
https://bioconductor.org/packages/release/bioc/vignettes/DESeq2/inst/doc/DESeq2.html#differential-expression-analysis
Thanks Michael. That worked.
Hi Michael,
Thanks for your clear explanation. But does it not make more sense if one can get gene expression value (normalized) from both condition to its corresponding log fold change?
May be I miss it in the manual but can you direct me to get gene expression value of each sample and also for each replicates?
Thanks in advance,
See the vignette section, “Access to all calculated values”