
Hello guys.
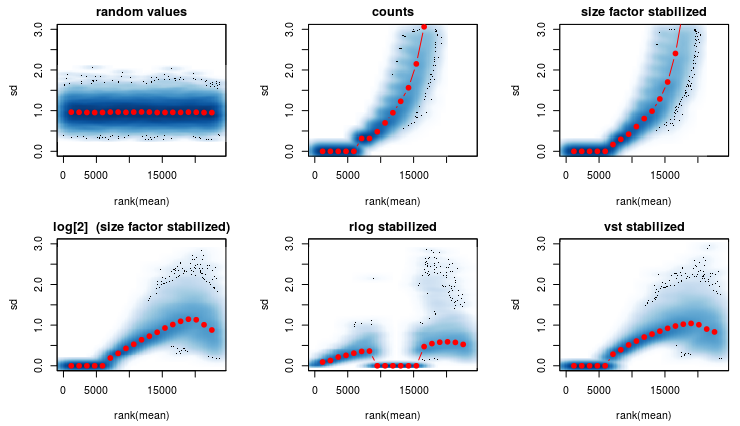
I am using the rlog transformation from DEseq2 (see first figure) and it produces a strange graph. 1th graph are random numbers. 2nd are the raw counts. 3rd are normalized raw counts etc.
Question1): In the 5th graph- Why are the red dots so close to the x axis? It should more or less look like the first graph. Any ideas on whats causing this?
After some thinking I went on and reduced my data keeping only genes that are expressed in among ALL samples (second figure).
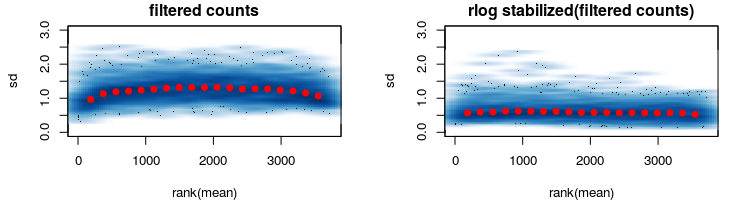
Here rlog does what its supposed to do.
Question2) While we are at it- Is this the correct order for normalization (estimateSizeFactors) + VST(variance stabilizing transformation):
1) rlogTransformation(dds)
2) estimateSizeFactors(dds)
It cant be anything else since rlogTransformation(dds) only takes a DEseqdataset as input with integers. After estimateSizeFactors(dds) and obtaining the counts with counts() the integers are transformed to double. So there is no way I could use rlogTransformation(counts(dds,normalized=T)), right?
Thanks a lot!
John
For the sake of completeness- the figures are generated with the "vsn" package and the transformations with "DEseq2".


Dear Michael,
I did as you said and sent an email to your @gmail.com address. I accidentally included the library("reshape2") - you dont need that, just remove or ignore it.
The data is not simulated. Here is the session info:
> sessionInfo()
R version 3.1.1 (2014-07-10)
Platform: i686-pc-linux-gnu (32-bit)
locale:
[1] LC_CTYPE=en_US.UTF-8 LC_NUMERIC=C
[3] LC_TIME=de_DE.UTF-8 LC_COLLATE=en_US.UTF-8
[5] LC_MONETARY=de_DE.UTF-8 LC_MESSAGES=en_US.UTF-8
[7] LC_PAPER=de_DE.UTF-8 LC_NAME=C
[9] LC_ADDRESS=C LC_TELEPHONE=C
[11] LC_MEASUREMENT=de_DE.UTF-8 LC_IDENTIFICATION=C
attached base packages:
[1] grid parallel stats4 stats graphics grDevices utils
[8] datasets methods base
other attached packages:
[1] gridExtra_0.9.1 reshape2_1.4.1
[3] vsn_3.34.0 Biobase_2.26.0
[5] ggplot2_1.0.1 DESeq2_1.6.3
[7] RcppArmadillo_0.4.650.1.1 Rcpp_0.11.5
[9] GenomicRanges_1.18.4 GenomeInfoDb_1.2.4
[11] IRanges_2.0.1 S4Vectors_0.4.0
[13] BiocGenerics_0.12.1
loaded via a namespace (and not attached):
[1] acepack_1.3-3.3 affy_1.44.0 affyio_1.34.0
[4] annotate_1.44.0 AnnotationDbi_1.28.2 base64enc_0.1-2
[7] BatchJobs_1.6 BBmisc_1.9 BiocInstaller_1.16.4
[10] BiocParallel_1.0.3 brew_1.0-6 checkmate_1.5.2
[13] cluster_2.0.1 codetools_0.2-11 colorspace_1.2-6
[16] DBI_0.3.1 digest_0.6.8 fail_1.2
[19] foreach_1.4.2 foreign_0.8-63 Formula_1.2-0
[22] genefilter_1.48.1 geneplotter_1.44.0 gtable_0.1.2
[25] Hmisc_3.15-0 iterators_1.0.7 KernSmooth_2.23-14
[28] lattice_0.20-31 latticeExtra_0.6-26 limma_3.22.7
[31] locfit_1.5-9.1 MASS_7.3-40 munsell_0.4.2
[34] nnet_7.3-9 plyr_1.8.1 preprocessCore_1.28.0
[37] proto_0.3-10 RColorBrewer_1.1-2 rpart_4.1-9
[40] RSQLite_1.0.0 scales_0.2.4 sendmailR_1.2-1
[43] splines_3.1.1 stringr_0.6.2 survival_2.38-1
[46] tools_3.1.1 XML_3.98-1.1 xtable_1.7-4
[49] XVector_0.6.0 zlibbioc_1.12.0