
Dear Bioconductor users,
I'm currently using limma to reprocess some (not so) old microarray data originally acquired using the following platform: Agilent-026652 Whole Human Genome Microarray 4x44K v2 comparing a tumor sample and the matched "healthy" region nearby, in the same biopsy.
I'm interested in differential gene expression, as usual, but I get really weird MAplots (and quite compressed BoxPlots) in the preprocessing step. Here is an example:
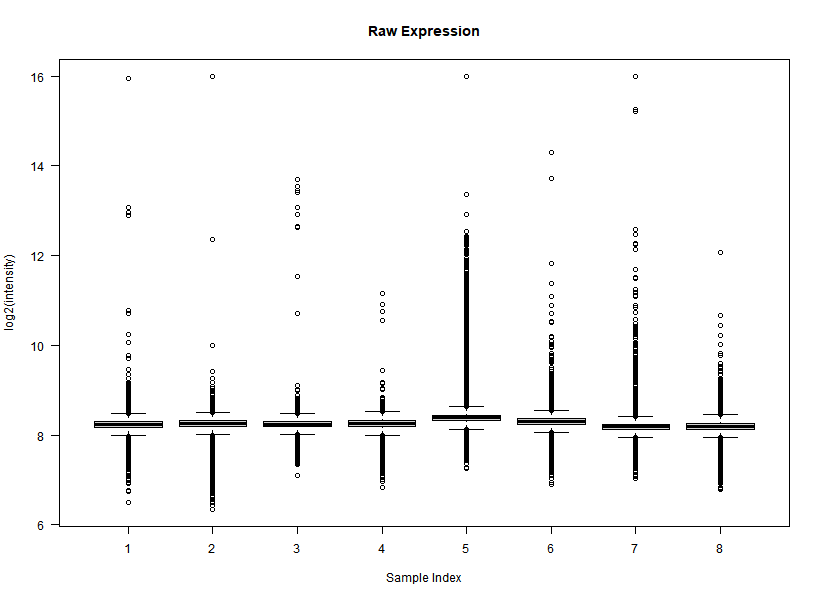
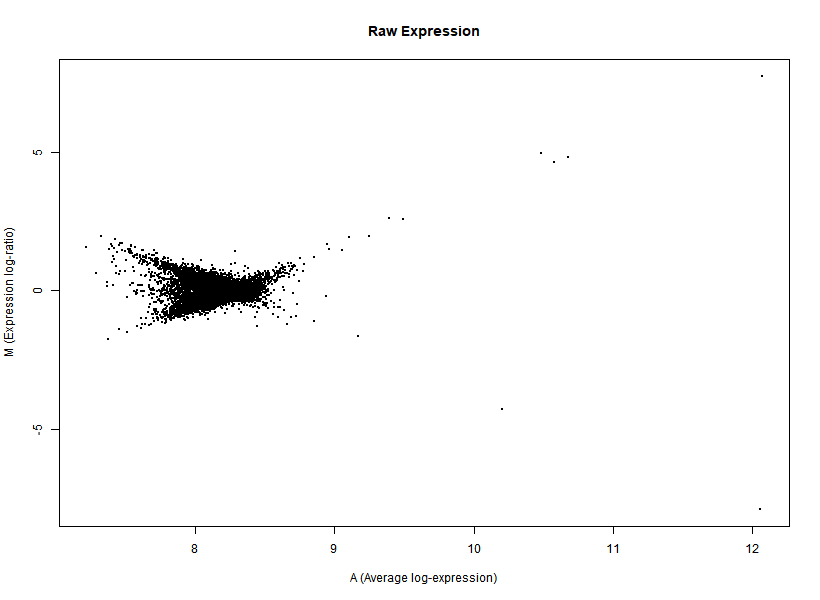
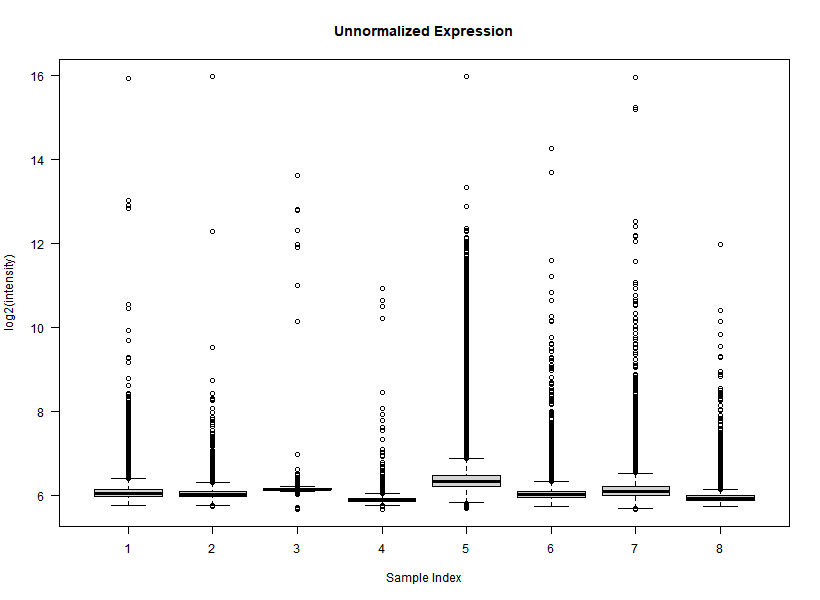
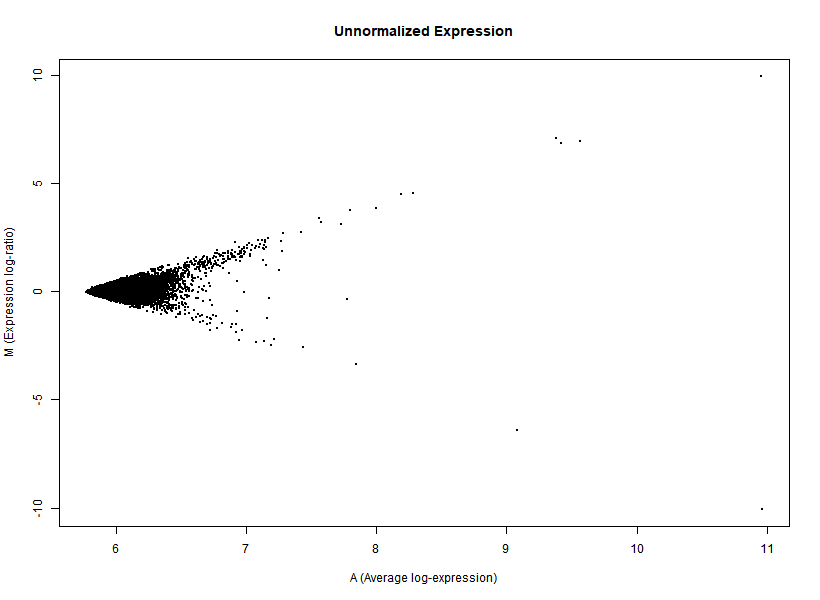
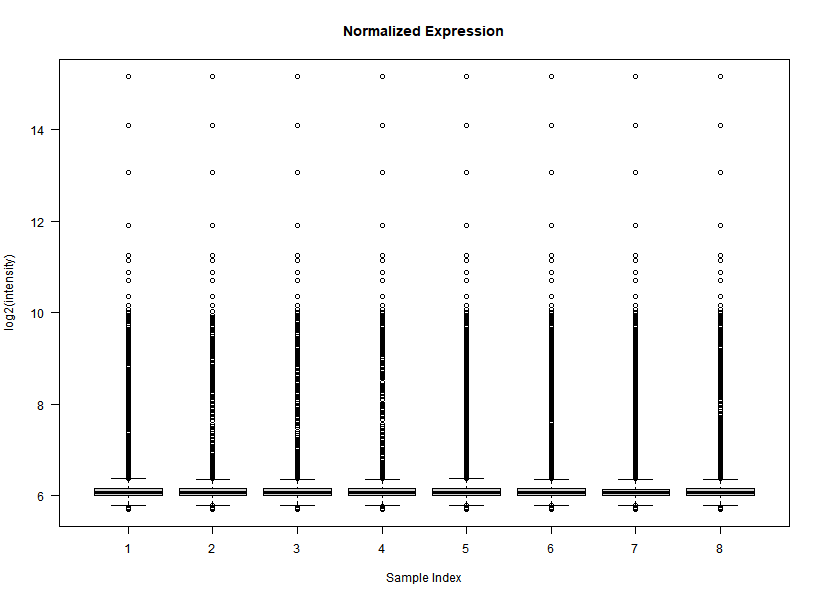
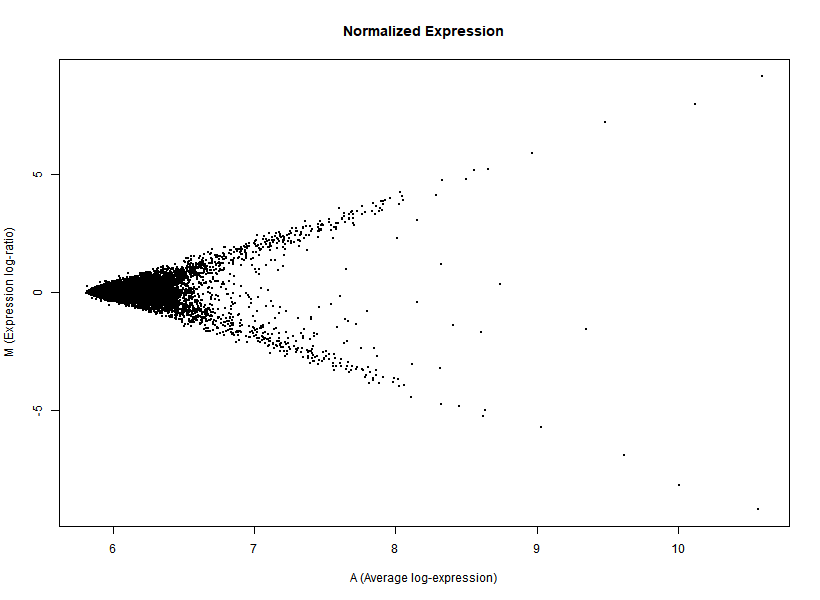
It seems like the typical bulk of the highly-expressed-unchanged genes is completely missing, while all the DEGs have been "pushed" towards the two diagonals of the plot... Never seen something like this before... Do you think this is biologically reliable? Maybe some problem with hybridization or scanning?
Any help/suggestion/comment from anyone more experienced than me is welcome!
Thank you so much!
I think the problem is in the biology or in the wet-lab step, and not in the coding. However, here is the (very essential and almost standard) code I used:
library(limma)
targets = readTargets("Targets.txt", row.names = "SampleNumber")
raw = read.maimages(targets, source = 'agilent.median', green.only = TRUE)
   # Here I generate some QC plots of Raw data
raw_BGcorrected = backgroundCorrect(raw, method = "normexp", offset = 50)
   # Here I generate some QC plots of BG-subtracted data
raw_BGandNormalized = normalizeBetweenArrays(raw_BGcorrected, method = "quantile")
   # Here I generate some QC plots of Normalized data

Cross-posted: https://www.biostars.org/p/496383/