Entering edit mode

Hello,
I'm new in bioinformatic and I would like to normalize HTseqcount data to do a survival analysis. How can I choose the best normalization ?
Thank you for your help !!
Hello,
I'm new in bioinformatic and I would like to normalize HTseqcount data to do a survival analysis. How can I choose the best normalization ?
Thank you for your help !!
Use of this site constitutes acceptance of our User Agreement and Privacy Policy.

I try this transformation :
I have this boxplot :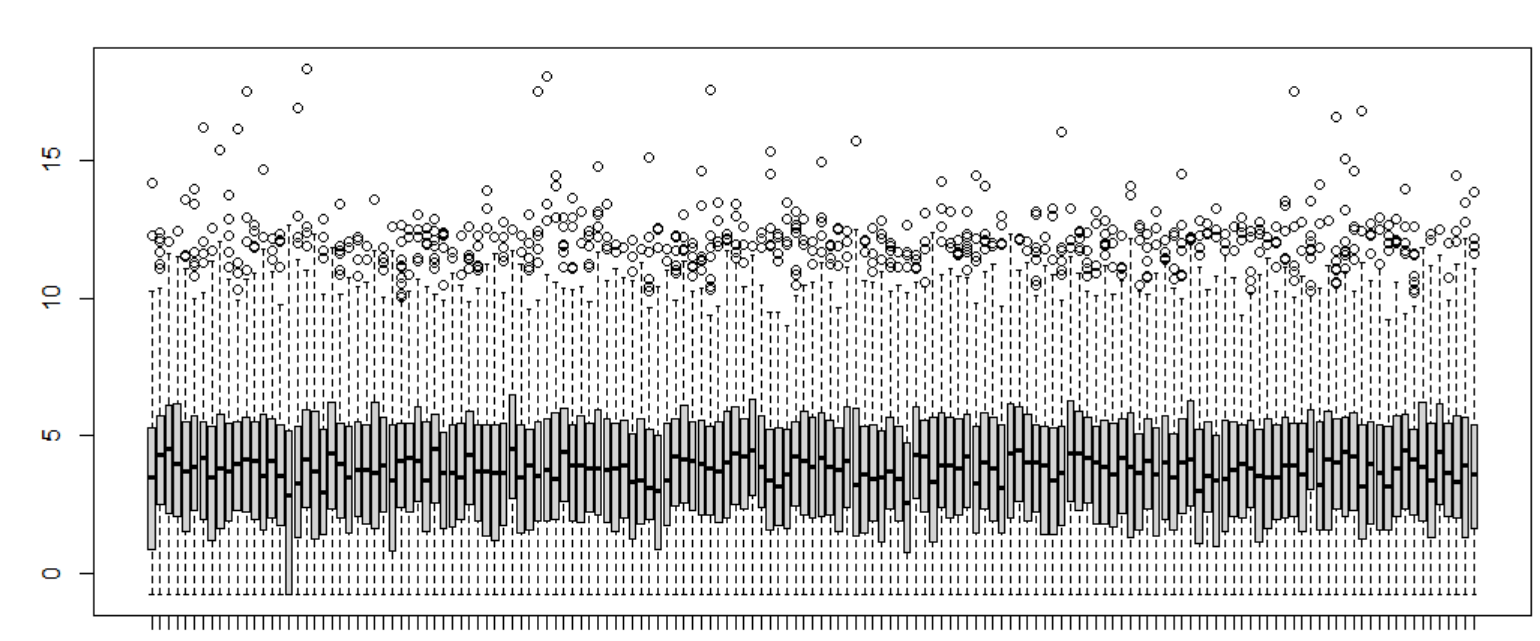
All medians are not align ... How can I align all medians to have a good normalization ?
VST is not quantile normalization. It adjusts for sequencing depth and transforms to log2 scale. It also does not perform sample QC for you.
..and, for the survival analysis part, I would take the VST expression levels and then follow my tutorial from Step 2, here: Tutorial:Survival analysis with gene expression
I would like to predict how many month a patient stay in life after the diagnostics. I need to test each gene independently ?
Can I use the median ratio method normalization and VST method ? How can I do QC ? I'm sorry I'm new in bioinformatic ...
This is out of scope for what I can provide on the support site. Consult a bioinformatician perhaps, or a general purpose site such as biostars (see Kevin's post above).
Thank you for your help.
I'm sorry, I have a new question with vst. I try to use vst and represente data with meanSdPlot like in the vignette and I don't have a real difference between normalized data and vst data. It's normal ?
Thank you !
As I said, VST is similar to log2 transformation, but has better stabilization of variance of small count genes.
The user now posted on Biostars https://www.biostars.org/p/9464165/#9464165
Thank you for your answer !