
Hello,
My name is Abby Spangler and I'm a research associate at the Lieber Institute working under Leo Collado-Torres and Kristen Maynard. You analyzed some of our Visium data for your bioRxiv paper on BayesSpace and showed some very nice results. We are trying to use BayesSpace on our newest round of Visium data for the same brain region, but the results are looking different to what you present in your bioRxiv paper. The enchanced clustering seems to be more dispersed than the regular clustering which is the opposite of what we would expect. Would you be able to tell us which parameters you used for spatialPreprocess(), spatialCluster(), and spatialEnhance() when you analyzed our data for your paper? I'm attaching our code and an example figure we generated. We used BayesSpace version 1.0.0.
Thanks,
Abby Spangler
Code should be placed in three backticks as shown below
library(SingleCellExperiment)
library(ggplot2)
library(BayesSpace)


sample_names <- c("DLPFC_1", "DLPFC_2")

for (i in 1:2) {

  sample_name <- sample_names[i]
  visium_dir <- paste0("/spatialDLPFC/outputs/NextSeq/",sample_name,"/outs/")
  #read data into sce object
  sce <- readVisium(visium_dir)

  #pre-processing
  set.seed(100)
  dlpfc <- spatialPreprocess(sce, platform = "Visium")

  #selecting the number of clusters
  dlpfc <- qTune(dlpfc, qs=seq(2, 10), platform="Visium", d=7)

  pdf(file = paste0("/spatialDLPFC/plots/BayesSpace/",sample_name, "BayesSpace_likelihood.pdf"))

  qPlot(dlpfc)
  dev.off()


  set.seed(100)
  dlpfc <- spatialCluster(dlpfc, q = 7, platform = "Visium",
                        nrep = 1000, burn.in = 100)


  pdf(file = paste0("/spatialDLPFC/plots/BayesSpace/",sample_name, "BayesSpace_clusterPlot.pdf"))
  clusterPlot(dlpfc)
  dev.off()

  #enhanced resolution
  dlpfc_enhanced <- spatialEnhance(dlpfc, q = 7, platform = "Visium",
                                 nrep = 1000, burn.in = 100)


  pdf(file = paste0("/spatialDLPFC/plots/BayesSpace/", sample_name, "BayesSpace_enhanced_clusterPlot.pdf"))
  clusterPlot(dlpfc_enhanced)
  dev.off()
}
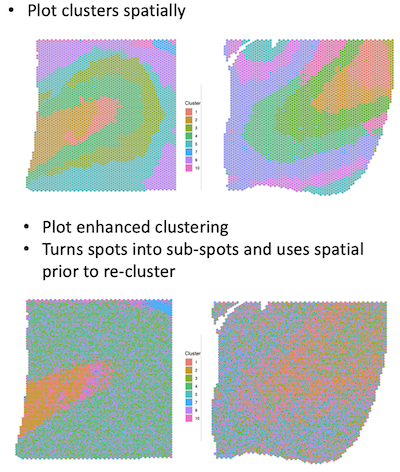
The first row shows the regular clustering for 2 samples. The second row shows the enhanced clusters which look less defined.
Hi Abby,
Thanks for trying BayesSpace on your new data. From a first glance, I would suggest running for more iterations. We suggest running at least 10,000 iterations for the spot-level clustering and 100,000 iterations for the subspot-level enhancement. In our manuscript, these numbers are 50k and 200k respectively. Note that this will take substantial computational time for the enhancement, so it would be best if you have high performance computing resources available.
We generally use the enhancement in cases when we expect the clusters to be less smooth and/or if there are regions with mixing of two or more clusters. In the previous DLPFC samples, the layers were quite smooth so we felt that the spot-level clustering was sufficient. That said, the results from the enhancement do seem unusual, even with the low number of iterations. If you are able to share the data, I'd be happy to take a look at it.
Best, Edward
Thank you, Edward. We will send you the data after bioconductor 3.13 is released. We need to re-make the data objects after that release, In the meantime, I will try running BayesSpace with more iterations.
Also, here is the working link to my poster on this project: https://speakerdeck.com/abspangler13/gbd2021-spatialdlpfc