
Dear List,
I am trying to duplicate the analysis using csaw in the paper, "From reads to regions", https://pubmed.ncbi.nlm.nih.gov/26834993/ I received different values than the paper for the number of mapped and marked reads, the fragment length, and cross-correlation plot. I am sticking as closely as I can to the protocol. I am asking the discrepancy is due to a change in the software, an error on my part, and most importantly if it compromises the analysis in the rest of the protocol. I am pasting in the script and then giving the problematic output preceded by a '."
sra.numbers <- c("SRR499718", "SRR499719", "SRR499720", "SRR499721",
    "SRR499734", "SRR499735", "SRR499736", "SRR499737", "SRR499738")
grouping <- c("proB-8113", "proB-8113", "proB-8108", "proB-8108",
    "matureB-8059", "matureB-8059", "matureB-8059", "matureB-8059", "matureB-8086")

all.sra <- sra.numbers
data.frame(SRA=all.sra, Condition=grouping)

for (sra in all.sra) {
    code <- system(paste("/Applications/sratoolkit.2.10.9-mac64/bin/fastq-dump", sra))
     stopifnot(code==0L)
}
all.fastq <- paste0(sra.numbers, ".fastq")

by.group <- split(all.fastq, grouping)
for (group in names(by.group)) {
    code <- system(paste(c("cat", by.group[[group]], ">",
          paste0(group, ".fastq")), collapse=" "))
     stopifnot(code==0L)
}
group.fastq <- paste0(names(by.group), ".fastq")

library(Rsubread)
bam.files <- paste0(names(by.group), ".bam")
align(index="mm10", readfile1=group.fastq, TH1=2, type=1,
    input_format="FASTQ", output_file=bam.files)


library(Rsamtools)

for (bam in bam.files) {
       out <- suppressWarnings(sortBam(bam, "h3k9ac_temp"))
    file.rename(out, bam)
}


# Mark duplicates

temp.bam <- "h3k9ac_temp.bam"
temp.file <- "h3k9ac_metric.txt"
temp.dir <- "h3k9ac_working"
dir.create(temp.dir)
for (bam in bam.files) {
    code <- system(sprintf(
       "java -jar /Applications/picard.jar MarkDuplicates I=%s O=%s M=%s \\
      TMP_DIR=%s AS=true REMOVE_DUPLICATES=false \\
      VALIDATION_STRINGENCY=SILENT", bam, temp.bam,
      temp.file, temp.dir))
    stopifnot(code==0L)
     file.rename(temp.bam, bam)
}

# count reads and generate diagnostics

diagnostics <- list()
for (bam in bam.files) {
    total <- countBam(bam)$records
    mapped <- countBam(bam, param=ScanBamParam(
     flag=scanBamFlag(isUnmapped=FALSE)))$records
    marked <- countBam(bam, param=ScanBamParam(
     flag=scanBamFlag(isUnmapped=FALSE, isDuplicate=TRUE)))$records
    diagnostics[[bam]] <- c(Total=total, Mapped=mapped, Marked=marked)
}
diag.stats <- data.frame(do.call(rbind, diagnostics))
diag.stats$Prop.mapped <- diag.stats$Mapped/diag.stats$Total*100
diag.stats$Prop.marked <- diag.stats$Marked/diag.stats$Mapped*100
diag.stats
> diag.stats
                    Total   Mapped  Marked Prop.mapped Prop.marked
matureB-8059.bam 16675372 12814838 2315308    76.84889   18.067400
matureB-8086.bam  6347683  5749367  392871    90.57426    6.833291
proB-8108.bam    10413135  9755975  611246    93.68912    6.265350
proB-8113.bam    10724526 10088710  730440    94.07138    7.240172
Results for Mapped and Marked differ from the published paper.
indexBam(bam.files)


library(rtracklayer)
ch <- import.chain("mm9ToMm10.over.chain")
original <- import("mm9-blacklist.bed")
blacklist <- liftOver(x=original, chain=ch)
blacklist <- unlist(blacklist)
saveRDS(file="mm10-blacklist.rds", blacklist)


celltype <- sub("-.*",  "", bam.files)
data.frame(BAM=bam.files,  CellType=celltype)
targets <- data.frame(BAM=bam.files,  CellType=celltype)

library(csaw)
standard.chr <- paste0("chr", c(1:19, "X", "Y"))
param <- readParam(minq=50, discard=blacklist,restrict=standard.chr)

x <- correlateReads(bam.files, param=reform(param, dedup=TRUE))
frag.len <- which.max(x) - 1
> frag.len
[1] 0
since I got a fragment length of 0, I used a slightly different "correlateReads" command.
 x <- correlateReads(bam.files,param=readParam(dedup=TRUE))
> frag.len <- which.max(x) - 1
> frag.len
[1] 20
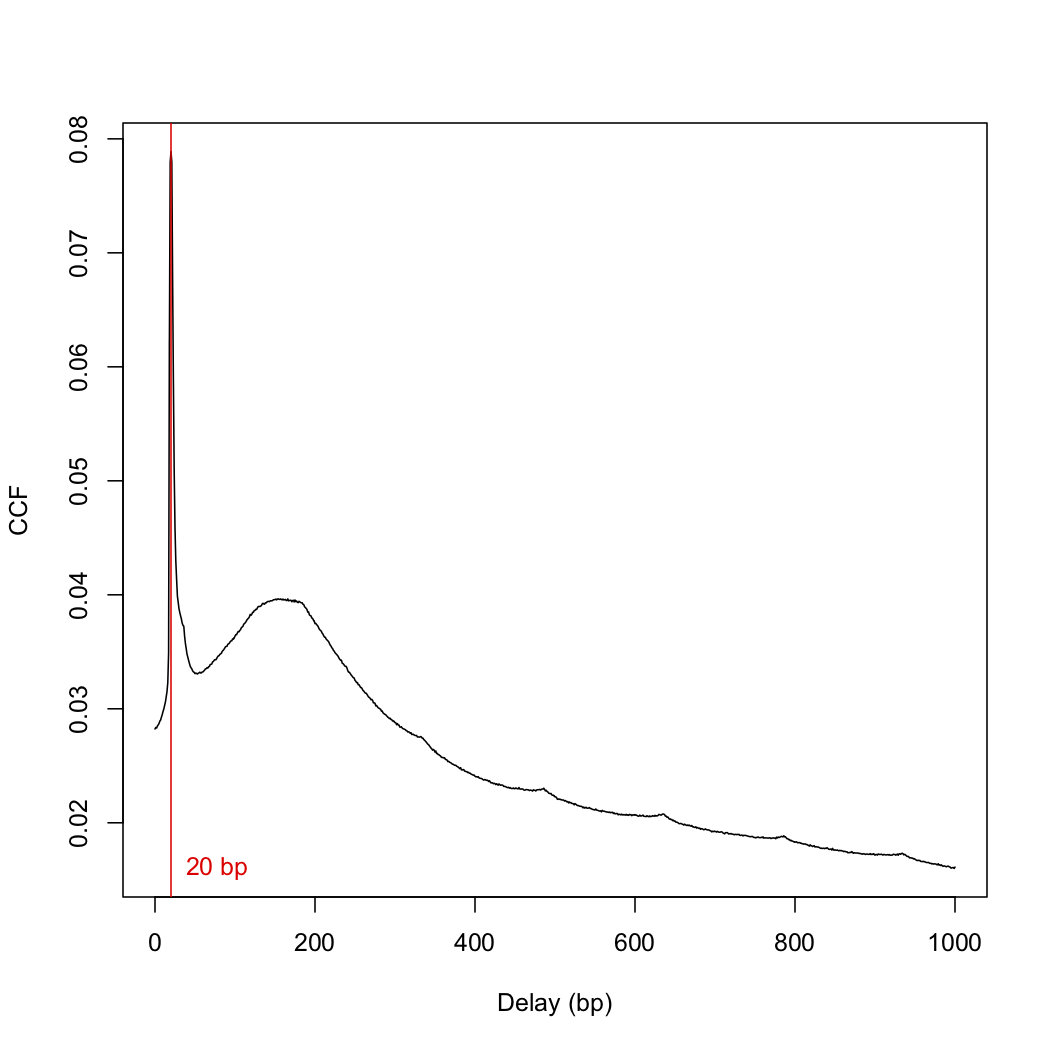
This number differs from the frag.len of 148 in the paper. I then plotted the cross-correlation function:
plot(1:length(x)-1, x, xlab="Delay (bp)", ylab="CCF", type="l")
abline(v=frag.len, col="red")
text(x=frag.len, y=min(x), paste(frag.len, "bp"), pos=4, col="red")
> sessionInfo()
R version 4.0.5 (2021-03-31)
Platform: x86_64-apple-darwin17.0 (64-bit)
Running under: macOS Mojave 10.14.6

Matrix products: default
BLAS:   /Library/Frameworks/R.framework/Versions/4.0/Resources/lib/libRblas.dylib
LAPACK: /Library/Frameworks/R.framework/Versions/4.0/Resources/lib/libRlapack.dylib

locale:
[1] en_US.UTF-8

attached base packages:
[1] stats4    parallel  stats     graphics  grDevices utils     datasets  methods   base

other attached packages:
 [1] csaw_1.24.3                 SummarizedExperiment_1.20.0 Biobase_2.50.0              MatrixGenerics_1.2.1
 [5] matrixStats_0.58.0          rtracklayer_1.50.0          Rsamtools_2.6.0             Biostrings_2.58.0
 [9] XVector_0.30.0              GenomicRanges_1.42.0        GenomeInfoDb_1.26.7         IRanges_2.24.1
[13] S4Vectors_0.28.1            BiocGenerics_0.36.1         Rsubread_2.4.3

loaded via a namespace (and not attached):
 [1] locfit_1.5-9.4           Rcpp_1.0.6               lattice_0.20-44          prettyunits_1.1.1        assertthat_0.2.1
 [6] utf8_1.2.1               BiocFileCache_1.14.0     R6_2.5.0                 RSQLite_2.2.7            httr_1.4.2
[11] pillar_1.6.0             zlibbioc_1.36.0          rlang_0.4.11             GenomicFeatures_1.42.3   progress_1.2.2
[16] curl_4.3.1               blob_1.2.1               Matrix_1.3-3             BiocParallel_1.24.1      stringr_1.4.0
[21] RCurl_1.98-1.3           bit_4.0.4                biomaRt_2.46.3           DelayedArray_0.16.3      compiler_4.0.5
[26] pkgconfig_2.0.3          askpass_1.1              openssl_1.4.4            tidyselect_1.1.1         tibble_3.1.1
[31] GenomeInfoDbData_1.2.4   edgeR_3.32.1             XML_3.99-0.6             fansi_0.4.2              crayon_1.4.1
[36] dplyr_1.0.6              dbplyr_2.1.1             rappdirs_0.3.3           GenomicAlignments_1.26.0 bitops_1.0-7
[41] grid_4.0.5               lifecycle_1.0.0          DBI_1.1.1                magrittr_2.0.1           stringi_1.6.1
[46] cachem_1.0.4             limma_3.46.0             xml2_1.3.2               ellipsis_0.3.2           vctrs_0.3.8
[51] generics_0.1.0           tools_4.0.5              bit64_4.0.5              glue_1.4.2               purrr_0.3.4
[56] hms_1.0.0                fastmap_1.1.0            AnnotationDbi_1.52.0     BiocManager_1.30.15      memoise_2.0.0
>
Thanks and best wishes,
Rich
Richard Friedman,
Columbia University Cancer Center

Dear Aaron.
I redid the fragment length calculation with the protocol in your online book and with the bam files provided by chipseqDBData and I got exactly the fragment length and graph that was in the online book.
I redid the fragment length calculation with the bam files I had generated, and I got a reasonable fragment length (149) and the attached ccf graph.
Does the spike at low distances present a problem insofar as further analyses are concerned.
Also I am still bothered by the discrepancy between number of mapped reads between the published "reads to regions paper", my own analysis, and the online book. Here is an example:
What I got: Total Mapped
matureB-8059.bam 16675372 12814838
online book. Total Mapped h3k9ac-matureB-8059 16675372 4670364
Reads to regions paper. Total Mapped
bmatureB-8059.bam 16675372 7752077
The number of mapped reads differ by almost a factor of 3!
I cannot help but suspect that this discreapncy is not simply due to chnages in Rsubread but also differences in the input parameters. was
align(index="index/mm10", readfile1=group.fastq, TH1=2, type=1, input_format="FASTQ", output_file=bam.files)
use to perform the alignment?
May I suggest that an up-to-date protocol from the sra files to the bam files be posted, so that users of csaw know exactly what to do?
Thanks and best wishes,
Rich
No. This is just a phantom peak, see the ENCODE papers for a discussion of why this occurs.
Much easier said than done. As it is, the book already takes some effort to maintain and that doesn't even deal with the vagaries of the preprocessing software. I would not be willing to regenerate the BAM files from scratch at every release cycle and check that the results are consistent - this is simply not reasonable.
The most I can offer are the scripts that were used to generate the files in the chipseqDBData package. Version numbers of the software are embedded in the BAM files themselves; for example, for the H3K4me3 dataset, I see Rsubread 1.33.9 and MarkDuplicates 2.17.11.
Aaron,
Thank you. Your reply successfully addresses my concern.
Best wishes, Rich