DESeq2 numbers of DEGs not consistent with PCA plot
2
0
Entering edit mode
Jane ▴ 10
@jkhudyakov-23010
Last seen 9 months ago
United States

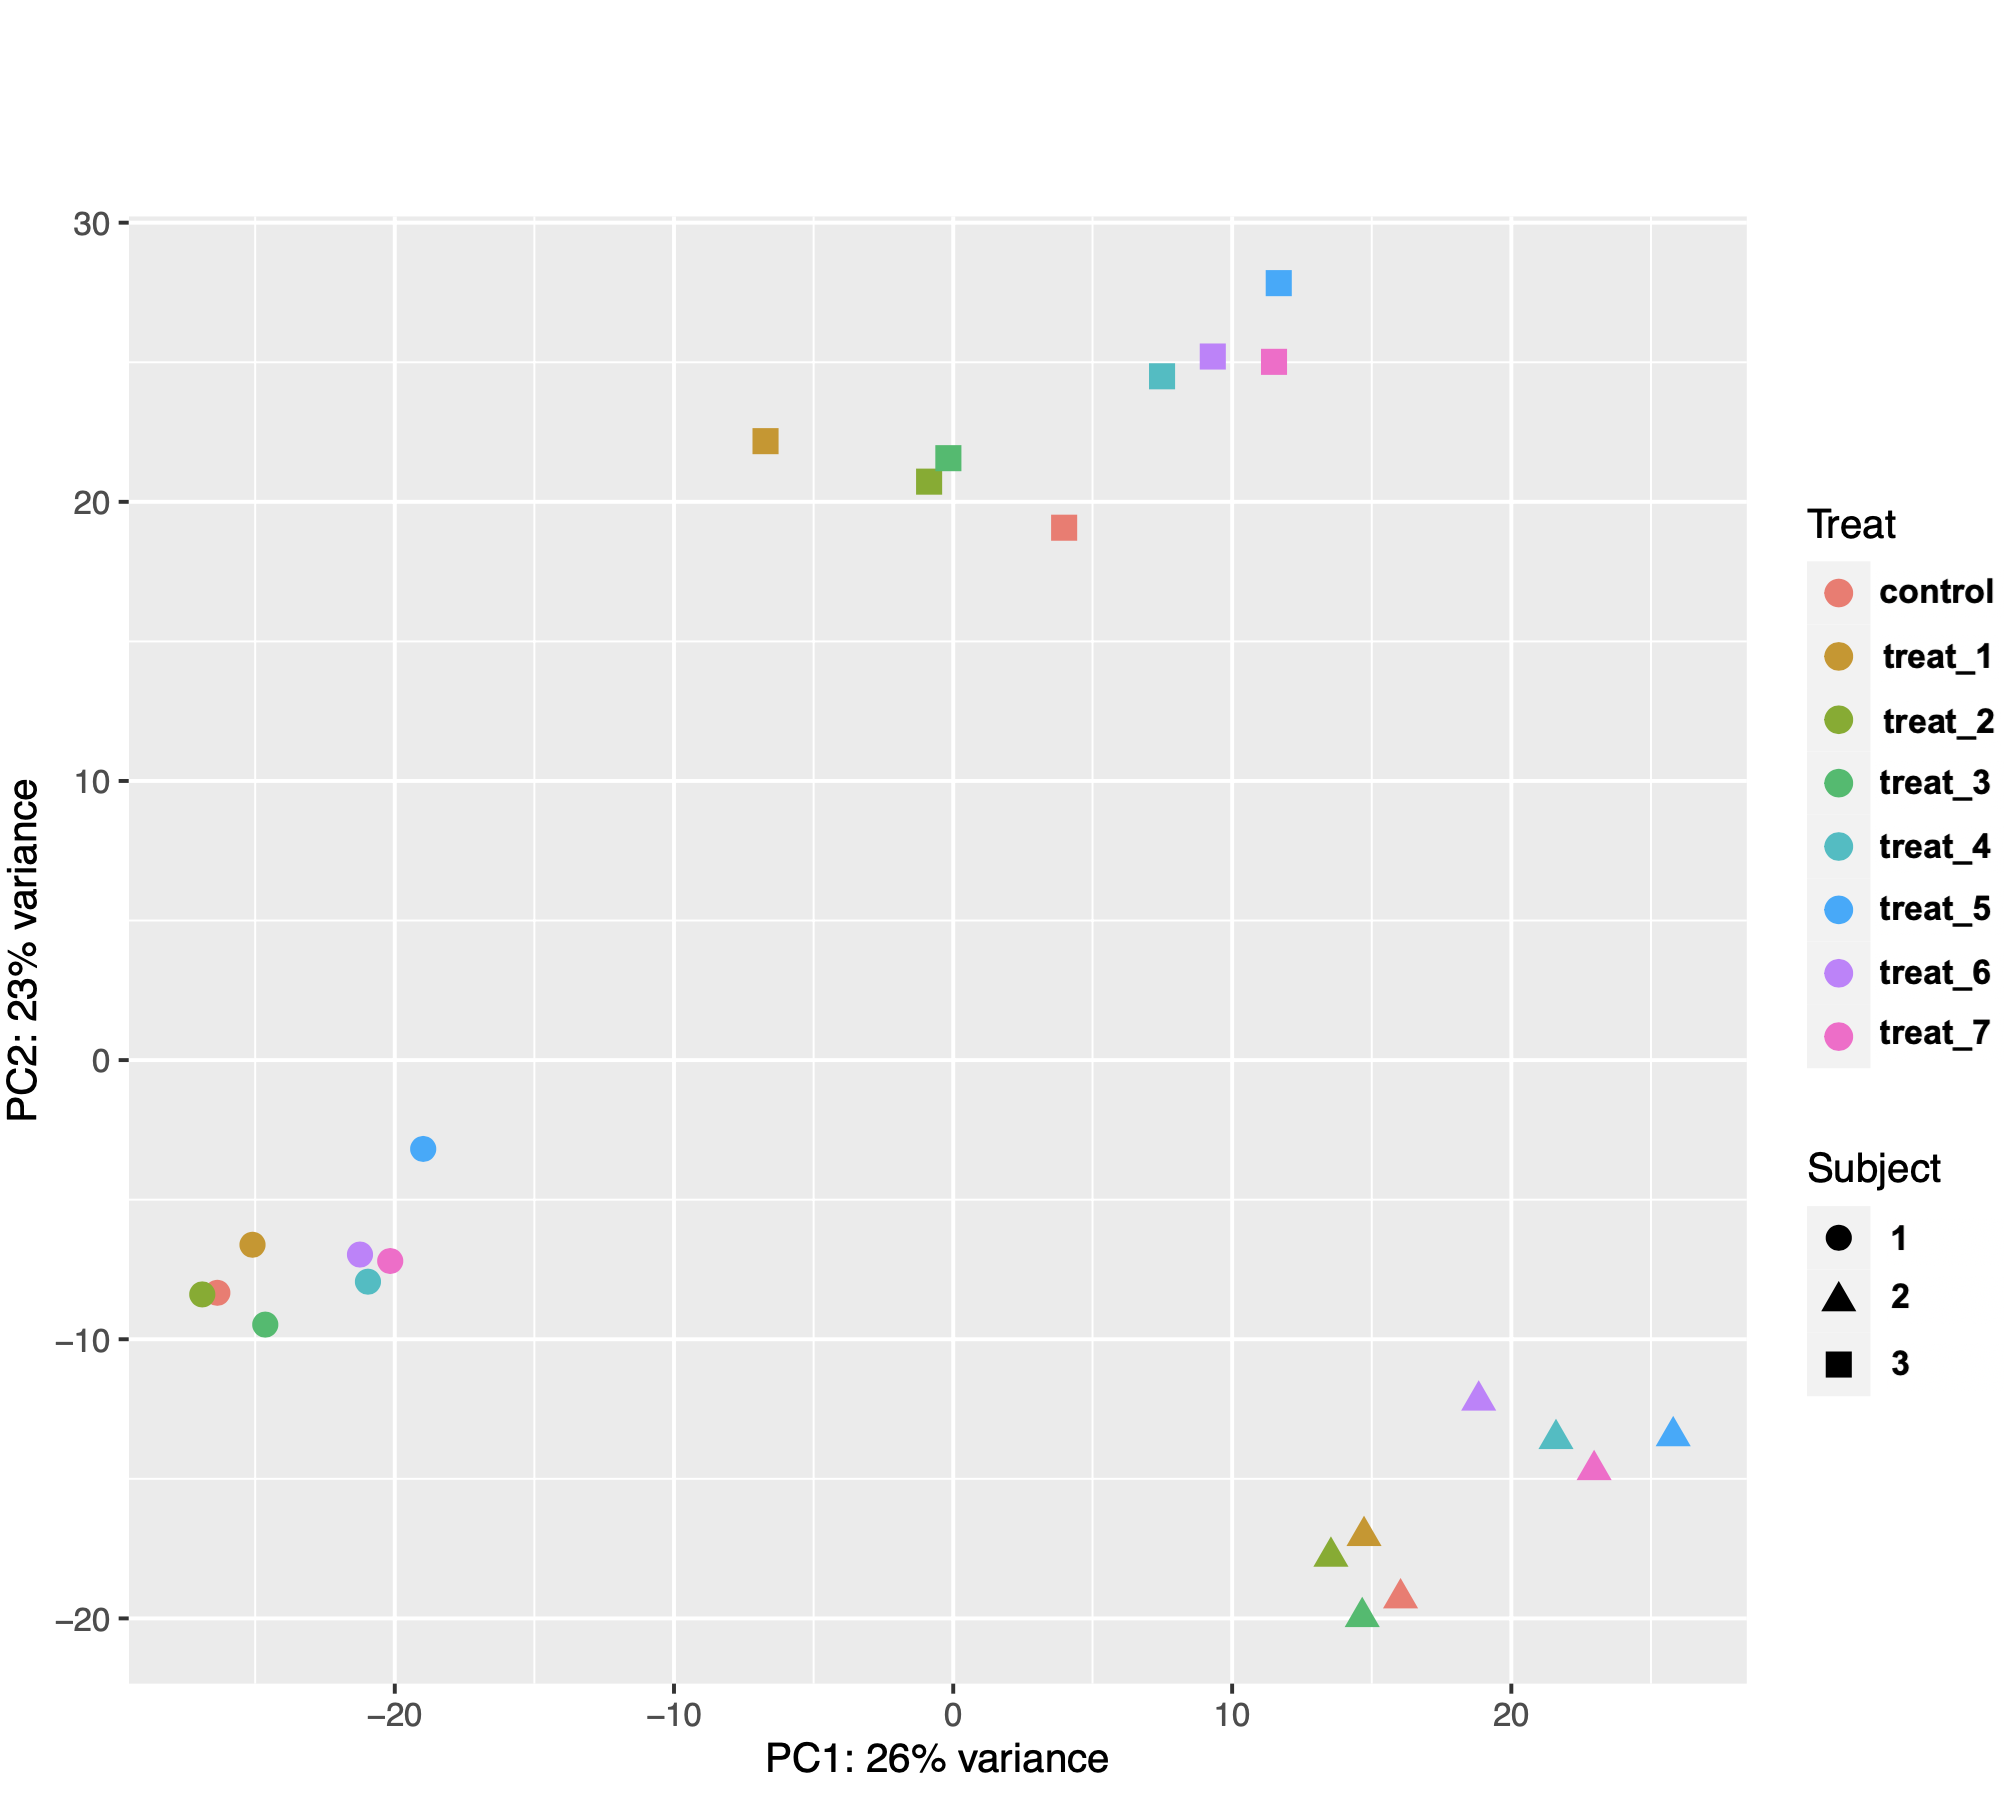
I am using DESeq2 to identify genes that are differentially expressed in mammalian tissue (n = 3 subjects) in response to 8 different treatments in culture. The PCA plot of the samples showed that gene expression was more variable between the biological replicates (subjects) than between treatments (see image below). This made sense biologically because the treatments were applied to subsamples from the same tissue samples from each animal. enter image description here

I then used the following model design with subject as the blocking factor: design = ~ Subject + Treat. However, after extracting results for my comparisons of interest, I noticed that the number of DEGs was not consistent with the distances between samples on the PCA plot. I know that the gene counts used for PCA are transformed and those used for DE analysis are not, but they still seem really weird.

For example, I got 19 DEG for treat2 vs control, 24 DEG for treat3 vs control, but a whopping106 DEG for treat2 vs treat3. As another example, I got 37 DEG for treat4 vs control, 98 DEG for treat5 vs control, and 128 DEG for treat5 vs treat4. I used control as the reference level for contrasts, so I am wondering if the results function is doing something weird when extracting differences between two non-control treatments. I assumed that contrast = c("Treat", "treat_5, "treat_4") is essentially (treat5 – control) -– (treat4 – control). I get the same results if I use contrast = list("Treat_treat_5_vs_control", "Treat_treat_4_vs_control"). The code I used is below.

dds <- DESeqDataSetFromTximport(txi, 
                                colData = samples, 
                                design = ~ Subject + Treat)

dds$Treat <- relevel(dds$Treat, ref = "control")

dds <- DESeq(dds) 

# example comparisons
res1 <- results(dds, contrast = c("Treat", "treat_5", "control"), 
                               alpha = 0.05, pAdjustMethod="BH", 
                               lfcThreshold = 1, altHypothesis = "greaterAbs")

res2 <- results(dds, contrast = c("Treat", "treat_5", "treat_4"), 
                               alpha = 0.05, pAdjustMethod="BH", 
                               lfcThreshold = 1, altHypothesis = "greaterAbs")

# PCA plot
vsd <- vst(dds, fitType="local", blind=FALSE)

pcaData <- plotPCA(vsd, intgroup=c("Treat", "Subject"), returnData=TRUE)

percentVar <- round(100 * attr(pcaData, "percentVar"))

ggplot(pcaData, aes(PC1, PC2, color=Treat, shape=Subject)) +
  geom_point(size=3) +
  xlab(paste0("PC1: ",percentVar[1],"% variance")) +
  ylab(paste0("PC2: ",percentVar[2],"% variance")) + 
  coord_fixed()
DifferentialExpression DESeq2 contrasts • 2.0k views
ADD COMMENT
1
Entering edit mode
swbarnes2 ★ 1.3k
@swbarnes2-14086
Last seen 17 hours ago
San Diego

I don't think what you are describing is a problem. I don't think you should expect much correspondence at all between what you can eyeball from that PC1 and PC2, and what the software,when correctly run, tells you.

ADD COMMENT
1
Entering edit mode

Agree with swbarnes. The relative number of DEG can't be inferred from the PCA plot in the way you are suggesting.

I recommend looking at plotCounts per gene of interest if you want to investigate DEG results.

ADD REPLY
0
Entering edit mode

Thank you, I will do that!

ADD REPLY
0
Entering edit mode
Jane ▴ 10
@jkhudyakov-23010
Last seen 9 months ago
United States

I think I figured out the issue with DEG numbers for comparisons that were higher than what made sense to us biologically.

First of all, I was not using lfcShrink to shrink fold changes for genes that had very low or variable expression and thus could be removed from the analyses.

Second of all, for comparisons between conditions other than control, I was not releveling the contrasts. I assumed that although I set control as the reference level, I would still be able to compare let's say Treat7 to Treat 6 by running

res <- results(dds, contrast = c("Treat", "treat_7", "treat_6")

However, when I set Treat6 as the reference level, I get a very different DEG list that makes a lot more biological sense. So it seems that releveling correctly is essential.

ADD COMMENT
0
Entering edit mode

Releveling shouldn't have much change on the sum(res$padj < X, na.rm=TRUE) numbers. It does affect shrinkage, but if you see large changes in the simple adjusted p-values I'd like to know more. Could you post the code that demonstrates that releveling changes the padj < X numbers for a particular contrast?

ADD REPLY
0
Entering edit mode

I am getting totally different DEGs identified with each approach. Here is the code that I was using:

With control as reference level:

dds <- DESeqDataSetFromTximport(txi, colData = samples, design = ~ Subject + Treat) 
keep <- rowSums(counts(dds) >= 5) >= 3
dds <- dds[keep,]
dds$Treat <- relevel(dds$Treat, ref = "control")
dds <- DESeq(dds) 
res1 <- results(dds, contrast = c("Treat", "treat_7", "treat_6"), alpha = 0.1, pAdjustMethod="BH", lfcThreshold = 1, altHypothesis = "greaterAbs")

With treat_6 as reference level:

dds$Treat <- relevel(dds$Treat, ref = "treat_6")
dds <- DESeq(dds) 
res2 <- results(dds, contrast = c("Treat", "treat_7", "treat_6"), alpha = 0.1, pAdjustMethod="BH", lfcThreshold = 1, altHypothesis = "greaterAbs")

And here are the differences between DEG lists produced by res1 (ref = control) and res2 (ref = treat_6) enter image description here

ADD REPLY
0
Entering edit mode

The difference could be due to one of the conditions having all zeros, which makes puts the LFC at the boundary of the parameter space (some of the LFC are then no longer finite). Then this would support your approach of releveling to treatment 6 for this contrast.

ADD REPLY
0
Entering edit mode

That makes sense, thank you!

ADD REPLY

Login before adding your answer.

Traffic: 820 users visited in the last hour
Help About
FAQ
Access RSS
API
Stats

Use of this site constitutes acceptance of our User Agreement and Privacy Policy.

Powered by the version 2.3.6