Entering edit mode

hello, I am trying to change the size text of x and y axis in plotMD under EdgeR package, however I couldn't find any solution to it. how is it possible to do it? thank you.
hello, I am trying to change the size text of x and y axis in plotMD under EdgeR package, however I couldn't find any solution to it. how is it possible to do it? thank you.

Do you mean the text in the legend? Anyway, just make the dimensions of your graphics window smaller, then all points, labels and text in the plot will become relatively larger, with everything still in proportion. This is a universal R solution, not limited to edgeR.
If you want more control, plotMD accepts the usual range of R graphics parameters, which control all sorts of things including axis label sizes, see ?par.
Use of this site constitutes acceptance of our User Agreement and Privacy Policy.
I mean the axis x and y and their number as well change the font to bold. also is it possible to store the produced graph as follow:
p<- plotMD(dgeTestFilt, xlab = "Average log-expression", ylab = "Expression log-ratio (this sample vs others)") but i didn't work .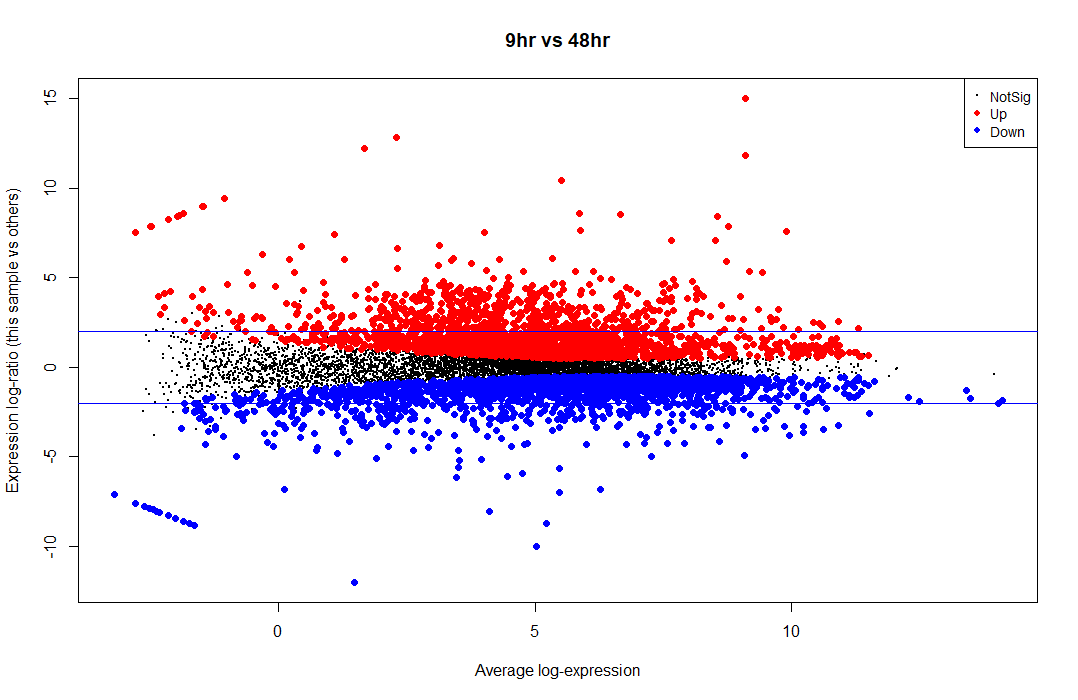
Yes, you can save any plot in R. See the help pages:
If you are using a gui like Rstudio or R for Windows then there are other options as well. The help pages also explain how to change the plot window dimensions.
it is possible to edit the image through use of illustrator, just i was wondering if it is possible to do it through Rstudio as I did for the pca figure:
A<- A+ theme(axis.text.x = element_text(angle = 0, size=14, face= "bold"), axis.text = element_text( size = 14, face="bold"), axis.text.y = element_text(size=14, face= "bold"), axis.title = element_text( size = 16, face = "bold" ), strip.text = element_text(size = 14, face= "bold"))+ theme(plot.title = element_text(size = 16, face = "bold"))+ theme(legend.title = element_text(size = 16, face="bold"), legend.text= element_text(size= 14, face= "bold")) A
Have you tried my original suggestion? It is a lot easier:
I will try your suggestion. just wondering if it is possible to do it through plotMD function.
plotMD accepts the usual range of R graphics parameters, see
?par.thank you a lot.