Entering edit mode

Hello, I have a question regarding to outputs from a DESeq2 analysis that I wasn't sure if it is normal. Briefly, I have an RNA-seq experiment analyzed by Salmon, imported into R by tximeta, and analyzed by DESeq2. After prefiltering, my DESeqDataset had 76015 transcripts.
keep <- rowSums(counts(dds)) >= 10 # genes with at least 10 reads across all samples
dds <- dds[keep, ]
dim(dds)
#[1] 76015   20
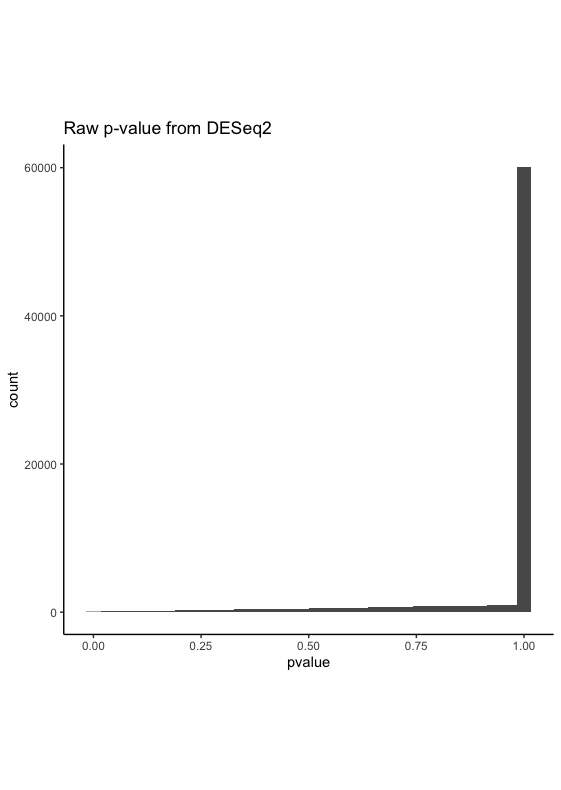
After running DESeq2, the raw pvalue has a distribution looks like below
And the adjusted p-value looks like below (I have to log transform the y-axis in order to show that I do have some padj near 0)
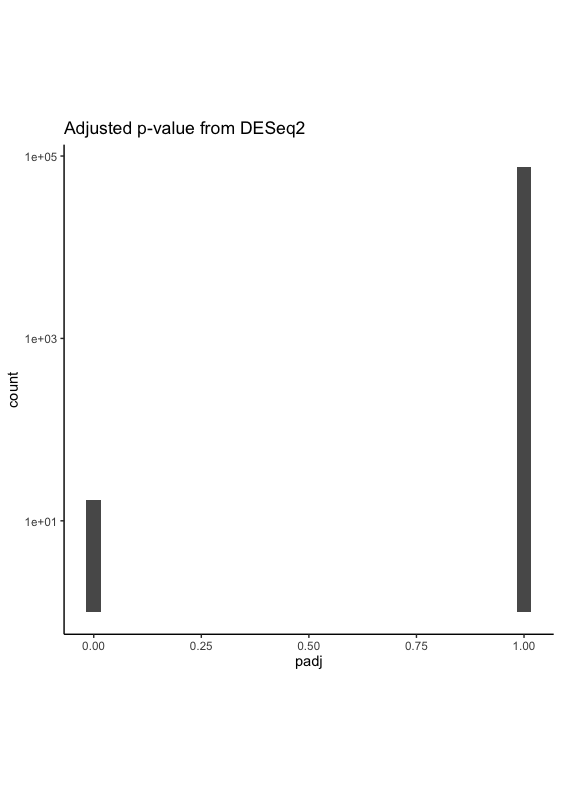
I wonder if this looks possible or indicates any serious issues. BTW there are about ~14000 NA in padj, which should not be the sole reason for this raw pvalue distribution.

Thanks! Yes, I guess I wasn't very clear with what I said. Yes, I did mean that the sum count from all samples is 10 or more. I could use more stringent criteria, but I thought this is not important so I just used what was written in the tutorial.
I did convert the NA in padj to 1 but not the NA in pvalue. And I just realized I have 1541 out of 76015 in pvalue to be NA, and I also have 14353 out of 76015 in padj to be NA.
It's hard for me to guess what's going on. I haven't seen a p-value histogram like that, and yes it indicates something is wrong in the pipeline. I would guess that something about the count matrix is very different than typical RNA-seq. I would do some more QC plots like PCA, and boxplots, scatterplots etc of the log counts.