Entering edit mode

Enter the body of text here
Code should be placed in three backticks as shown below
# include your problematic code here with any corresponding output
# please also include the results of running the following in an R session
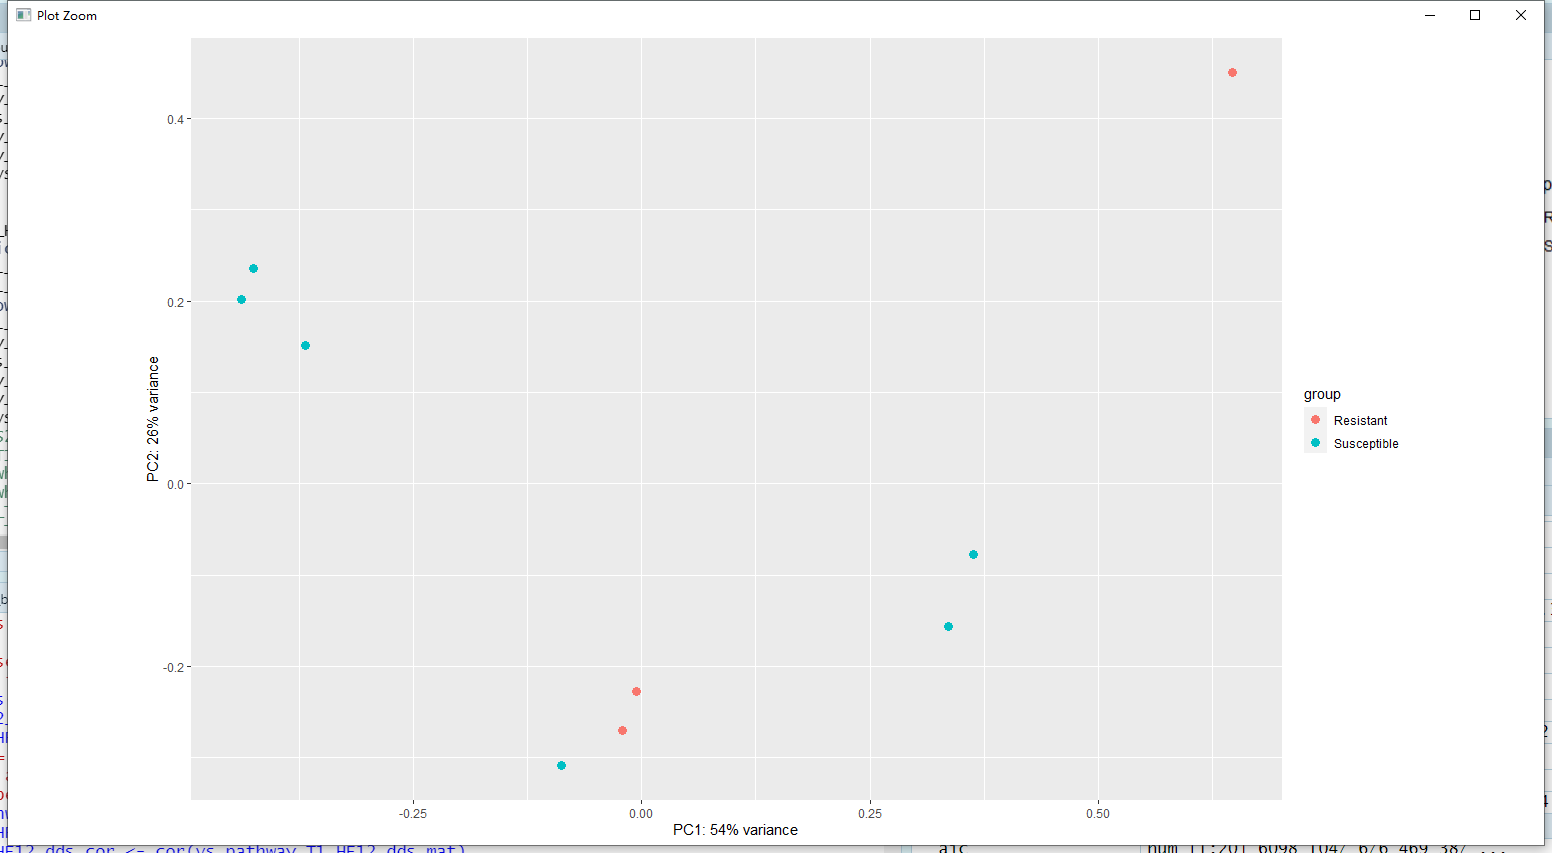
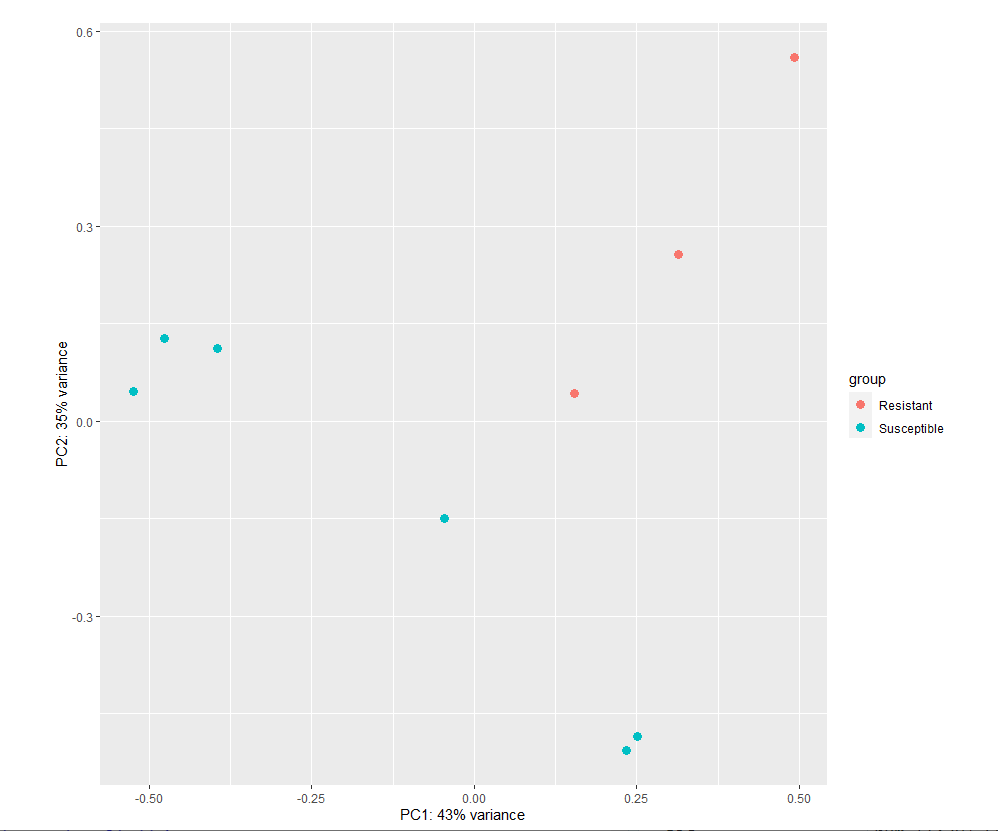
Hi, I am performing differential expression of pathway using deseq2. However, the pca plots were not decent. I want to find DEGs between Resistant and Susceptible, can I go further?
Here is my code,
design_T1_HF12 <- design[grep("T1", design$Treatment),] %>%
.[-which(.$Treatment %in% c("HG64T1")),]
pathway_T1_HF12 <- pathway[, rownames(design_T1_HF12)]
pathway_T1_HF12_dds <- DESeqDataSetFromMatrix(pathway_T1_HF12, design_T1_HF12, design = ~ Treatment)
keep <- rowSums(counts(pathway_T1_HF12_dds) >= 10) >= 3
pathway_T1_HF12_dds <- pathway_T1_HF12_dds[keep, ]
vs_pathway_T1_HF12_dds <- rlog(pathway_T1_HF12_dds, blind = FALSE)
plotPCA(vs_pathway_T1_HF12_dds, intgroup = "Property") # + geom_label(aes(label = name))
Any suggestions would be appreciated. Thanks.
sessionInfo( )
R version 4.0.3 (2020-10-10)
Platform: x86_64-w64-mingw32/x64 (64-bit)
Running under: Windows 10 x64 (build 18363)
Matrix products: default
locale:
[1] LC_COLLATE=Chinese (Simplified)_China.936 LC_CTYPE=Chinese (Simplified)_China.936
[3] LC_MONETARY=Chinese (Simplified)_China.936 LC_NUMERIC=C
[5] LC_TIME=Chinese (Simplified)_China.936
attached base packages:
[1] parallel stats4 grid stats graphics grDevices utils datasets methods
[10] base
other attached packages:
[1] DESeq2_1.28.1 SummarizedExperiment_1.18.2 DelayedArray_0.14.1
[4] matrixStats_0.58.0 Biobase_2.48.0 GenomicRanges_1.40.0
[7] GenomeInfoDb_1.24.2 IRanges_2.22.2 S4Vectors_0.26.1
[10] BiocGenerics_0.34.0 RColorBrewer_1.1-2 ComplexHeatmap_2.6.2
[13] tibble_3.0.6 magrittr_2.0.1 ggplot2_3.3.3
[16] MVN_5.8 reshape2_1.4.4 dplyr_1.0.7
[19] treemap_2.4-2 devtools_2.3.2 usethis_2.0.0
loaded via a namespace (and not attached):
[1] utf8_1.2.1 ks_1.13.1 tidyselect_1.1.1 RSQLite_2.2.3
[5] AnnotationDbi_1.50.3 BiocParallel_1.22.0 ranger_0.12.1 rainbow_3.6
[9] munsell_0.5.0 sROC_0.1-2 withr_2.4.2 colorspace_2.0-0
[13] energy_1.7-8 knitr_1.33 rstudioapi_0.13 robustbase_0.93-8
[17] vcd_1.4-8 VIM_6.1.0 labeling_0.4.2 GenomeInfoDbData_1.2.3
[21] cvTools_0.3.2 mnormt_2.0.2 bit64_4.0.5 farver_2.1.0
[25] rprojroot_2.0.2 vctrs_0.3.8 generics_0.1.0 xfun_0.23
[29] diptest_0.76-0 R6_2.5.0 robCompositions_2.3.0 clue_0.3-58
[33] locfit_1.5-9.4 mvoutlier_2.0.9 flexmix_2.3-17 bitops_1.0-6
[37] cachem_1.0.1 reshape_0.8.8 assertthat_0.2.1 promises_1.2.0.1
[41] scales_1.1.1 nnet_7.3-14 gtable_0.3.0 Cairo_1.5-12.2
[45] processx_3.5.2 rlang_0.4.10 genefilter_1.70.0 systemfonts_1.0.2
[49] GlobalOptions_0.1.2 splines_4.0.3 abind_1.4-5 httpuv_1.6.1
[53] tools_4.0.3 psych_2.1.3 zCompositions_1.3.4 gridBase_0.4-7
[57] ellipsis_0.3.2 kableExtra_1.3.4 proxy_0.4-26 sessioninfo_1.1.1
[61] Rcpp_1.0.6 plyr_1.8.6 zlibbioc_1.34.0 purrr_0.3.4
[65] RCurl_1.98-1.2 ps_1.5.0 prettyunits_1.1.1 GetoptLong_1.0.5
[69] zoo_1.8-9 haven_2.4.1 cluster_2.1.0 fs_1.5.0
[73] fda_5.1.9 tinytex_0.32 magick_2.7.1 data.table_1.14.0
[77] hdrcde_3.4 openxlsx_4.2.3 circlize_0.4.13 lmtest_0.9-38
[81] truncnorm_1.0-8 tmvnsim_1.0-2 mvtnorm_1.1-2 pkgload_1.1.0
[85] gsl_2.1-6 hms_1.1.0 mime_0.10 evaluate_0.14
[89] xtable_1.8-4 XML_3.99-0.5 rio_0.5.26 mclust_5.4.7
[93] readxl_1.3.1 shape_1.4.6 testthat_3.0.1 compiler_4.0.3
[97] KernSmooth_2.23-17 crayon_1.4.1 fds_1.8 htmltools_0.5.1.1
[101] mgcv_1.8-33 pcaPP_1.9-74 later_1.2.0 geneplotter_1.66.0
[105] tidyr_1.1.3 rrcov_1.5-5 DBI_1.1.1 MASS_7.3-53
[109] fpc_2.2-9 boot_1.3-25 Matrix_1.2-18 car_3.0-10
[113] cli_2.5.0 sgeostat_1.0-27 igraph_1.2.6 forcats_0.5.1
[117] pkgconfig_2.0.3 foreign_0.8-80 laeken_0.5.1 sp_1.4-5
[121] xml2_1.3.2 annotate_1.66.0 svglite_2.0.0 XVector_0.28.0
[125] webshot_0.5.2 rvest_1.0.0 NADA_1.6-1.1 stringr_1.4.0
[129] callr_3.7.0 digest_0.6.27 pracma_2.3.3 pls_2.7-3
[133] rmarkdown_2.8 cellranger_1.1.0 nortest_1.0-4 curl_4.3
[137] kernlab_0.9-29 shiny_1.6.0 modeltools_0.2-23 rjson_0.2.20
[141] lifecycle_1.0.0 nlme_3.1-149 carData_3.0-4 desc_1.3.0
[145] viridisLite_0.4.0 fansi_0.5.0 pillar_1.6.1 lattice_0.20-41
[149] GGally_2.1.1 fastmap_1.1.0 httr_1.4.2 DEoptimR_1.0-9
[153] pkgbuild_1.2.0 survival_3.2-7 glue_1.4.2 remotes_2.4.0
[157] zip_2.2.0 png_0.1-7 prabclus_2.3-2 bit_4.0.4
[161] class_7.3-17 stringi_1.5.3 blob_1.2.1 moments_0.14
[165] memoise_2.0.0 e1071_1.7-7
Here is the pca plots,