Entering edit mode

Hi, Dr Dr Love
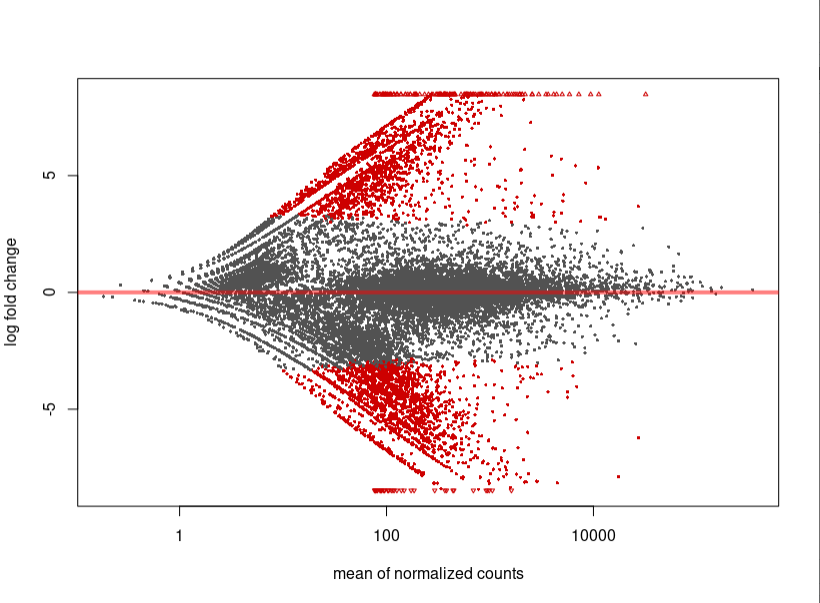
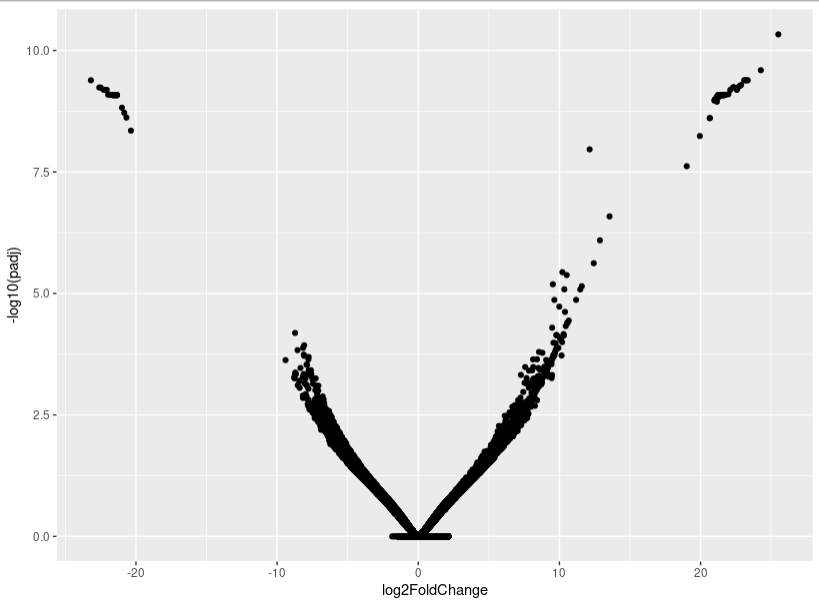
I find a werid MAplot or volcano plot of DESeq reuslt. I am wondering whether you can give me some advice.
This diff result is from two cell type bulk RNA-seq. I use two specific marker to get these two cell type using Flow cytometer. I alreadly know these cell type have very different RNA composition.
As you can see, the MA-plot is not like DESeq2 manul example. And the volcano plot is more werid, it looks like -log10(padj) is the linear function of log2FoldChange.
If you want to repeat my data, here is my data link:
https://github.com/shangguandong1996/picture_link/blob/main/WFX_count_Rmatrix.txt
And here is my code
# Prepare -----------------------------------------------------------------

# load up the packages
library(DESeq2)
library(dplyr)

library(ggplot2)

# Set Options
options(stringsAsFactors = F)

# load up the data
data <- read.table("rawdata/count/WFX_count_Rmatrix.txt",
                   header = TRUE,
                   row.names = 1)

coldata <- data.frame(row.names = colnames(data),
                      type = rep(c("Fx593", "Fx600"), each = 2))


# DESeq2 ------------------------------------------------------------------

dds <- DESeqDataSetFromMatrix(countData = data,
                              colData = coldata,
                              design= ~ type)
# PCA
vsd <- vst(dds)
plotPCA(vsd, intgroup = "type")

dds <- DESeq(dds)

res_lfc <- lfcShrink(dds = dds,
                     type = "ashr",
                     coef = "type_Fx600_vs_Fx593")

plotMA(res_lfc)

as_tibble(res_lfc) %>%
    mutate(padj = case_when(
        is.na(padj) ~ 1,
        TRUE ~ padj
    )) %>%
    ggplot(aes(x = log2FoldChange, y = -log10(padj))) +
    geom_point()
> sessionInfo()
R version 3.6.1 (2019-07-05)
Platform: x86_64-pc-linux-gnu (64-bit)
Running under: CentOS Linux 7 (Core)

Matrix products: default
BLAS:   /opt/sysoft/R-3.6.1/lib64/R/lib/libRblas.so
LAPACK: /opt/sysoft/R-3.6.1/lib64/R/lib/libRlapack.so

locale:
 [1] LC_CTYPE=en_US.UTF-8       LC_NUMERIC=C
 [3] LC_TIME=en_US.UTF-8        LC_COLLATE=en_US.UTF-8
 [5] LC_MONETARY=en_US.UTF-8    LC_MESSAGES=en_US.UTF-8
 [7] LC_PAPER=en_US.UTF-8       LC_NAME=C
 [9] LC_ADDRESS=C               LC_TELEPHONE=C
[11] LC_MEASUREMENT=en_US.UTF-8 LC_IDENTIFICATION=C

attached base packages:
[1] parallel  stats4    stats     graphics  grDevices utils     datasets  methods
[9] base

other attached packages:
 [1] ggplot2_3.3.3               dplyr_1.0.5
 [3] DESeq2_1.26.0               SummarizedExperiment_1.16.0
 [5] DelayedArray_0.12.0         BiocParallel_1.19.6
 [7] matrixStats_0.58.0          Biobase_2.46.0
 [9] GenomicRanges_1.38.0        GenomeInfoDb_1.22.0
[11] IRanges_2.20.0              S4Vectors_0.24.0
[13] BiocGenerics_0.32.0

loaded via a namespace (and not attached):
 [1] bitops_1.0-7           bit64_4.0.5            doParallel_1.0.15
 [4] RColorBrewer_1.1-2     tools_3.6.1            backports_1.2.1
 [7] utf8_1.2.1             R6_2.5.0               rpart_4.1-15
[10] Hmisc_4.5-0            DBI_1.1.1              colorspace_2.0-1
[13] nnet_7.3-16            withr_2.4.2            tidyselect_1.1.0
[16] gridExtra_2.3          bit_4.0.4              compiler_3.6.1
[19] cli_2.5.0              htmlTable_2.1.0        labeling_0.4.2
[22] scales_1.1.1           checkmate_2.0.0        SQUAREM_2017.10-1
[25] genefilter_1.68.0      mixsqp_0.2-2           stringr_1.4.0
[28] digest_0.6.27          foreign_0.8-73         XVector_0.26.0
[31] pscl_1.5.2             base64enc_0.1-3        jpeg_0.1-8.1
[34] pkgconfig_2.0.3        htmltools_0.5.1.1      fastmap_1.1.0
[37] htmlwidgets_1.5.3      rlang_0.4.11           rstudioapi_0.13
[40] RSQLite_2.2.7          generics_0.1.0         farver_2.1.0
[43] RCurl_1.98-1.3         magrittr_2.0.1         GenomeInfoDbData_1.2.2
[46] Formula_1.2-4          Matrix_1.3-2           Rcpp_1.0.6
[49] munsell_0.5.0          fansi_0.4.2            lifecycle_1.0.0
[52] stringi_1.5.3          MASS_7.3-54            zlibbioc_1.32.0
[55] grid_3.6.1             blob_1.2.1             crayon_1.4.1
[58] lattice_0.20-44        splines_3.6.1          annotate_1.64.0
[61] locfit_1.5-9.4         knitr_1.33             pillar_1.6.0
[64] geneplotter_1.64.0     codetools_0.2-18       XML_3.99-0.3
[67] glue_1.4.1             packrat_0.5.0          latticeExtra_0.6-29
[70] data.table_1.12.6      png_0.1-7              vctrs_0.3.8
[73] foreach_1.4.7          gtable_0.3.0           purrr_0.3.3
[76] assertthat_0.2.1       ashr_2.2-39            cachem_1.0.4
[79] xfun_0.22              xtable_1.8-4           survival_3.2-11
[82] truncnorm_1.0-8        tibble_3.1.1           iterators_1.0.12
[85] AnnotationDbi_1.48.0   memoise_2.0.0          cluster_2.1.2
[88] ellipsis_0.3.2

This is probably a consequence of many rows with overall very low counts.
Here you see that only about 1/3 of your rows actually have more than 10 raw counts in at least two of the four samples. I guess this is where some pre-filtering will help removing spurious calls.
Thanks, AT. After
The MA or volcano plot is better. But I am wondering whether there are other advices for this data type, after all, this data type is "pseudo single-cell RNA-seq".
I also post a question in biostar
https://www.biostars.org/p/9484986/