Entering edit mode

onokaisaac
•
0
@f6ccf861
Last seen 2.7 years ago
Can somebody help me with how to overcome the errors.
I'm using xcms in R My spec data files are in two groups (SMP and BLK). The files are generated from LC-MS. Code is
library(xcms)
met2path<-system.file("met2", package = "faahKO")
met2path
met2files<-list.files(met2path, recursive = TRUE,full=T)
met2files
list.files(met2path, recursive = TRUE)
#peak picking#####################
xset<-xcmsSet(met2files)

#peak alignment########################
xsg<-group(xset)

#rt correction and visualize the results
xsg<-retcor(xsg, plottype= "mdevden")

#Filling the peaks

xsg<- group(xsg, bw=1)
xsg<- fillPeaks(xsg)

#get peak intensity matrix

dat<-groupval(xsg,"medret","into")
dat[1:4] #peaks are identified by m/z and retention times

#seeing the first 10
peaks(xsg)[1:10, ]

mypeaks<- peaks(xsg)
mypeaks[1:10, ]

# add a group label (phenoData)
dat<-rbind(group=as.character(phenoData(xsg)$class),dat)

#Save the data to csv################
write.csv(dat,file = "MyPeakTable.csv");
#this file can be uploaded directly to Metaboalyst for statistical analysis#

#Alternatively you can use a buidin function in xcms for statistical analysis

diff.res<-diffreport(xsg,"SMP","BLK")
diff.res[1:4,]

#inspect the quality of a particular aligned peak
gt<-groups(xsg);
gt[1:289, ]

write.csv(gt,file = "peaks.csv");

#Select peaks with median retention time (2600,2700), detected in least 8 samples
grp_inx<- which(gt[,"rtmed"] > 100 & gt[, "rtmed"] < 300 & gt[, "npeaks"] > 14)
grp_inx

#To obtain EIC of the first hit###########
eiccor<-getEIC(xsg,groupidx = grp_inx[1]);

#PLot the EIC, colored based on their class labels
plot(eiccor,col= as.numeric(phenoData(xsg)$class));

legend("right",c("SMP","BLK"),fill = c(1,2))


grp_inx
grp_inx <- which(gt[, "mzmin"] > 195.2111 & gt[, "mzmax"]< 196.4521 & gt[, "rtmax"] > 10)

grp_inx

#To obtain EIC of the first hit###########
eiccor<-getEIC(xsg,groupidx = grp_inx[1]);
#PLot the EIC, colored based on their class labels
plot(eiccor,col= as.numeric(phenoData(xsg)$class));

legend("right",c("BLK","SMP"),fill = c(1,2))

######################################

## ----load-with-msnbase, message = FALSE---------------------------------------
raw_data <- readMSData(files = mets2, pdata = new("NAnnotatedDataFrame", pd),
                       mode = "onDisk")

## ----subsetting, message = FALSE, echo = TRUE---------------------------------
raw_data <- filterRt(raw_data, c(50, 1560))

## ----data-inspection-rtime, message = FALSE-----------------------------------
head(rtime(raw_data))

## ----data-inspection-mz, message = FALSE--------------------------------------
mzs <- mz(raw_data)

## Split the list by file
mzs_by_file <- split(mzs, f = fromFile(raw_data))

length(mzs_by_file)

## ----data-inspection-bpc, message = FALSE, fig.align = "center", fig.width = 12, fig.height = 6----
## Get the base peak chromatograms. This reads data from the files.
bpis <- chromatogram(raw_data, aggregationFun = "max")
## Define colors for the two groups
group_colors <- paste0(brewer.pal(3, "Set1")[1:2], "60")
names(group_colors) <- c("SMP", "BLK")

## Plot all chromatograms.
plot(bpis, col = group_colors[raw_data$sample_group])
legend("right",c("SMP","BLK"),fill = c(1,2))

## ----data-inspection-chromatogram, message = FALSE----------------------------
bpi_1 <- bpis[1, 1]
head(rtime(bpi_1))
head(intensity(bpi_1))

## ----data-inspection-tic-boxplot, message = FALSE, fig.align = "center", fig.width = 8, fig.height = 4, fig.cap = "Distribution of total ion currents per file."----
## Get the total ion current by file
tc <- split(tic(raw_data), f = fromFile(raw_data))
boxplot(tc, col = group_colors[raw_data$sample_group],
        ylab = "intensity", main = "Total ion current")

## ----data-inspection-bpc-heatmap, message = FALSE, fig.align = "center", fig.width = 7, fig.height = 6, fig.cap = "Grouping of samples based on similarity of their base peak chromatogram."----
## Bin the BPC
bpis_bin <- MSnbase::bin(bpis, binSize = 2)

## Calculate correlation on the log2 transformed base peak intensities
cormat <- cor(log2(do.call(cbind, lapply(bpis_bin, intensity))))
colnames(cormat) <- rownames(cormat) <- raw_data$sample_name

## Define which phenodata columns should be highlighted in the plot
ann <- data.frame(group = raw_data$sample_group)
rownames(ann) <- raw_data$sample_name

library(pheatmap)
## Perform the cluster analysis
pheatmap(cormat, annotation = ann,
         annotation_color = list(group = group_colors))


Error: Error in hclust(d, method = method) :
  NA/NaN/Inf in foreign function call (arg 10)
Yours
Isaac Thank you in advance
sessionInfo( )
```

Hey Kevin,
I'm facing the same issue and I did view cormat based on your comment. That is when I saw those values and I have attached a screenshot. But I don't know what to do next as I am new to working with XCMS. Any help would be amazing.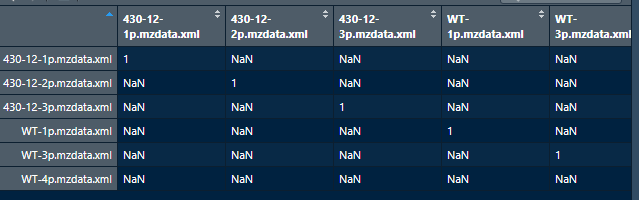
Thanks, Sanaa
I also have the same error. If your error is solved, please let me know how to resolve this.
The simple fix is to ensure you do not have any
NaNorInfvalues in your matrix. How you do that is dependent on where you got the data, and why you have those values.