Hello!
I have run into a result I cannot explain with DESeq2 and would greatly appreciate an explanation!
I am running DESeq2 and for 197 samples for two groups of comparison. I am not currently interested in interaction terms. My code looks as follows
dds <- DESeqDataSetFromMatrix(counts_ent_T,design_df , ~ param1+param2)
filter<-rowSums(counts(dds)>=10)>=10
dds<-dds[filter,]
dds<-DESeq(dds,parallel=T)
dds<-dds [which(mcols(dds)$betaConv), ]
and design_df looks as follows:
> design_df [1:6,]
           param1  param2
Sample1    bulk    bulk
Sample2    bulk    bulk
Sample3    bulk    bulk
Sample4    bulk    bulk
Sample5 outlier outlier
Sample6    bulk    bulk
where param1 has 30 "outlier"s and 167 "bulk"s, and param2 has 28 "outlier"s and 169 "bulk"s. Except for 4 samples param1 and param2 are the same.
The problem is in the results. As an example, I have looked at "Gene1":
res1<-results(dds,name="param1_outlier_vs_bulk")
res2<-results(dds,name="param2_outlier_vs_bulk")

> res1["Gene1",]
log2 fold change (MLE): param1 outlier vs bulk
Wald test p-value: param1 outlier vs bulk
DataFrame with 1 row and 6 columns
       baseMean log2FoldChange     lfcSE      stat      pvalue        padj
      <numeric>      <numeric> <numeric> <numeric>   <numeric>   <numeric>
Gene1   255.719       -12.7665   2.55447  -4.99771 5.80142e-07 0.000895952
> res2["Gene1",]
log2 fold change (MLE): param2 outlier vs bulk
Wald test p-value: param2 outlier vs bulk
DataFrame with 1 row and 6 columns
       baseMean log2FoldChange     lfcSE      stat      pvalue        padj
      <numeric>      <numeric> <numeric> <numeric>   <numeric>   <numeric>
Gene1   255.719        13.0614   2.61151   5.00145 5.69003e-07 0.000906422
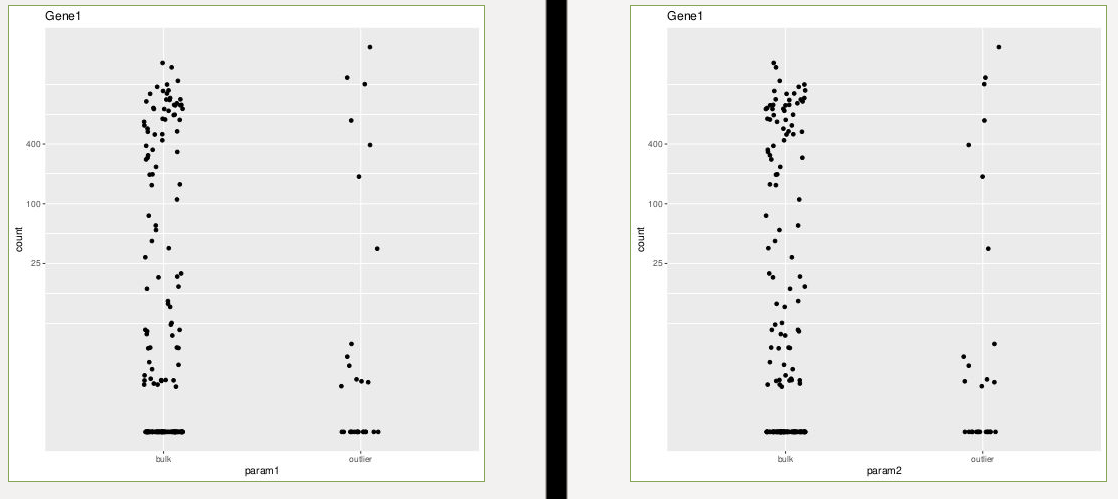
As you can see, the log2FoldChange is exactly opposite, while I didn't swap factor levels in the comparisons (comparing outlier vs bulk in both params). Moreover, plotcounts look as follows:
p1<-plotCounts(dds, gene=gene1, intgroup="param1", returnData=T)
p11<-ggplot(p1, aes(x=param1, y=count)) +
   geom_point(position=position_jitter(w=0.1,h=0)) +ggtitle("Gene1")+
  scale_y_log10(breaks=c(25,100,400))
ggsave(p11, file="plotcounts_param1_default.pdf")


p2<-plotCounts(dds, gene=gene1, intgroup="param2", returnData=T)
p22<-ggplot(p2, aes(x=param2, y=count)) +
   geom_point(position=position_jitter(w=0.1,h=0))+ggtitle("Gene1")+
   scale_y_log10(breaks=c(25,100,400))
ggsave(p22, file="plotcounts_param2_default.pdf")
So why are the log2FoldChanges exactly opposite? Is it really just the 2 samples with 0s that the outlier group in param1 gains?
Any help would be greatly appreciated.
Rita
sessionInfo()
R version 4.0.2 (2020-06-22)
Platform: x86_64-pc-linux-gnu (64-bit)
Running under: Ubuntu 20.04.3 LTS

Matrix products: default
BLAS:   /usr/lib/x86_64-linux-gnu/blas/libblas.so.3.9.0
LAPACK: /usr/lib/x86_64-linux-gnu/lapack/liblapack.so.3.9.0

locale:
 [1] LC_CTYPE=en_US.UTF-8       LC_NUMERIC=C
 [3] LC_TIME=de_DE.UTF-8        LC_COLLATE=en_US.UTF-8
 [5] LC_MONETARY=de_DE.UTF-8    LC_MESSAGES=en_US.UTF-8
 [7] LC_PAPER=de_DE.UTF-8       LC_NAME=C
 [9] LC_ADDRESS=C               LC_TELEPHONE=C
[11] LC_MEASUREMENT=de_DE.UTF-8 LC_IDENTIFICATION=C

attached base packages:
[1] parallel  stats4    stats     graphics  grDevices utils     datasets
[8] methods   base

other attached packages:
 [1] BiocParallel_1.24.1         purrr_0.3.4
 [3] ggplot2_3.3.3               dplyr_1.0.4
 [5] plyr_1.8.6                  DESeq2_1.30.1
 [7] SummarizedExperiment_1.20.0 Biobase_2.50.0
 [9] MatrixGenerics_1.2.1        matrixStats_0.58.0
[11] GenomicRanges_1.42.0        GenomeInfoDb_1.26.2
[13] IRanges_2.24.1              S4Vectors_0.28.1
[15] BiocGenerics_0.36.0         data.table_1.14.0

loaded via a namespace (and not attached):
 [1] Rcpp_1.0.6             locfit_1.5-9.4         lattice_0.20-41
 [4] snow_0.4-3             digest_0.6.27          assertthat_0.2.1
 [7] utf8_1.1.4             R6_2.5.0               RSQLite_2.2.3
[10] httr_1.4.2             pillar_1.5.0           zlibbioc_1.36.0
[13] rlang_0.4.10           annotate_1.68.0        blob_1.2.1
[16] Matrix_1.2-18          labeling_0.4.2         splines_4.0.2
[19] geneplotter_1.68.0     RCurl_1.98-1.2         bit_4.0.4
[22] munsell_0.5.0          DelayedArray_0.16.2    compiler_4.0.2
[25] pkgconfig_2.0.3        tcltk_4.0.2            tidyselect_1.1.0
[28] tibble_3.1.0           GenomeInfoDbData_1.2.4 XML_3.99-0.5
[31] fansi_0.4.2            crayon_1.4.1           withr_2.4.1
[34] bitops_1.0-6           grid_4.0.2             xtable_1.8-4
[37] gtable_0.3.0           lifecycle_1.0.0        DBI_1.1.1
[40] magrittr_2.0.1         scales_1.1.1           cachem_1.0.4
[43] farver_2.1.0           XVector_0.30.0         genefilter_1.72.1
[46] ellipsis_0.3.1         vctrs_0.3.6            generics_0.1.0
[49] RColorBrewer_1.1-2     tools_4.0.2            bit64_4.0.5
[52] glue_1.4.2             fastmap_1.1.0          survival_3.1-12
[55] AnnotationDbi_1.52.0   colorspace_2.0-0       memoise_2.0.0


Thank you, Michael. After your response, I found that running DESeq for each parameter separately seems to solve my problem and gives sensible results. I will just proceed with that!