Entering edit mode

Hi,
I am trying to understand what input the DataTrack function take from a GRange object. What metadata is included?
If there is only a single sample, no grouping needs to be done..
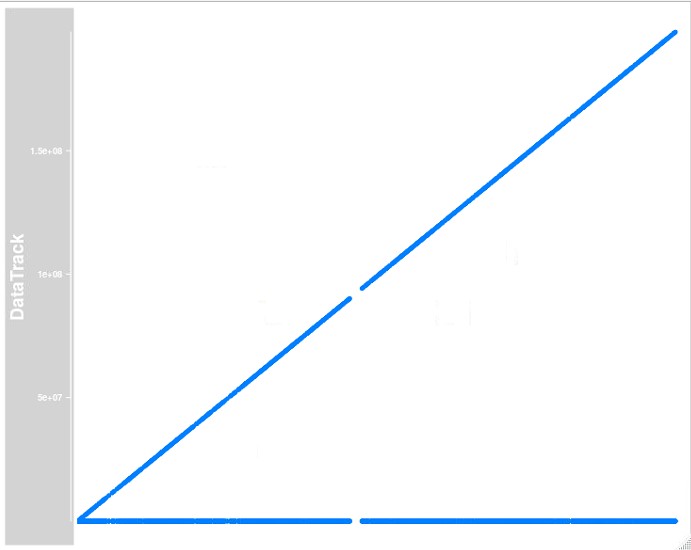
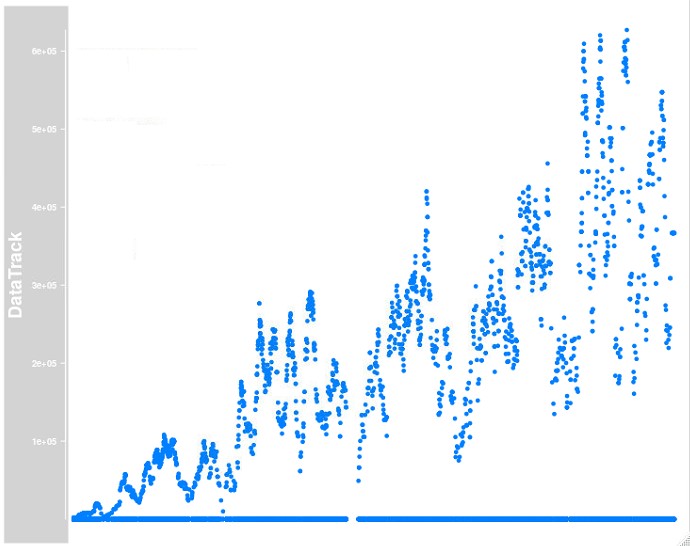
I am wondering because I have only a single sample; however, when I use the parameter window = -1 my plot appears completely different, so I am wondering what exactly is being summarized or averaged?
Code should be placed in three backticks as shown below
#figure out how this works..
dataTrack <- DataTrack(range = peaksGRange,
                       type = "p", #window = -1,
                       chromosome = "chr3",
                       start = 169003074 , end = 169005466)

plotTracks(dataTrack)
Hi again,
I am still waiting for someone to shed light on this? :)
Thanks
Hi,
Can you prepare reproducible example for this? What exactly is the "peaksGRange" object?
Best, Robert
I can provide the BigWigFile here in order to help.
I am mostly interested in the graphics, I would like to produce a smooth histogram of the data...
Hi Robert, I think for the most part I figured out some of the issues, but I am still troubled by the yaxis of the
DataTrackregion...When plotting together with
GeneReionTrackthe yaxis is transformed maybe? I can't find any documentation on this.. If you can explain how to change this as aschemethat would be very much appreciated.Thanks