Entering edit mode

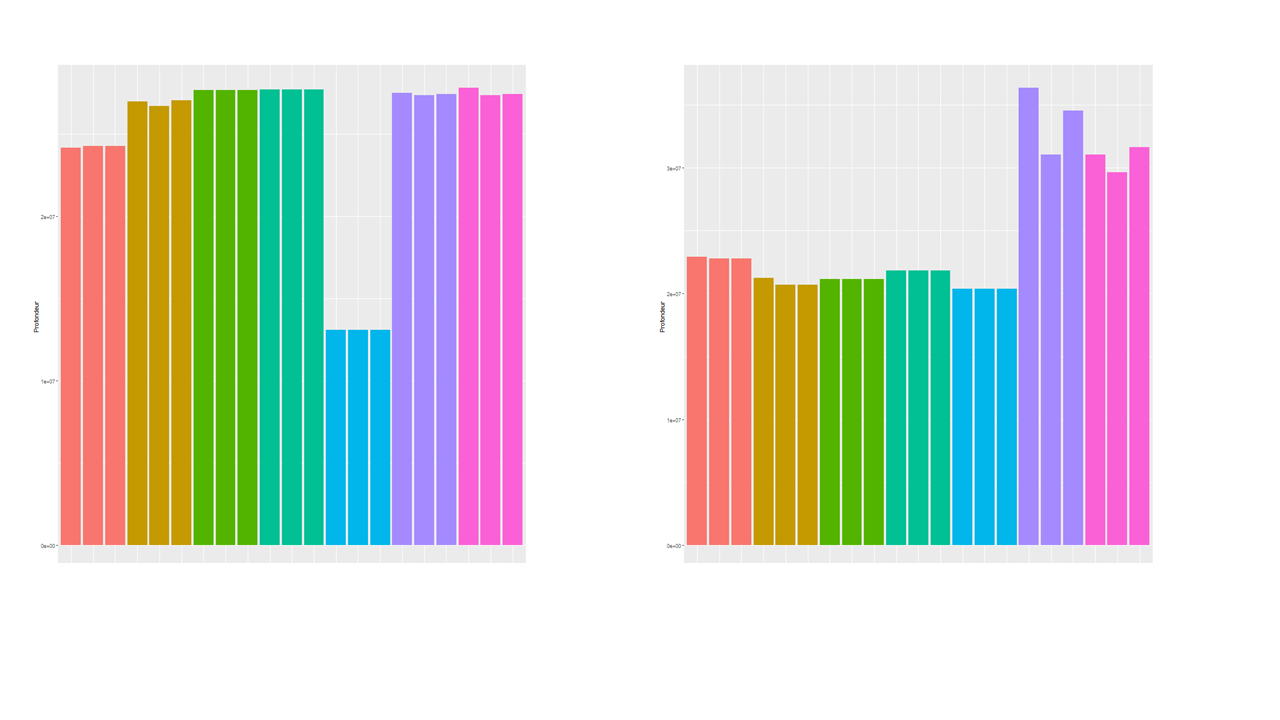
Hi, I'm still new to DESEQ2 and I wonder if I used everything correctly. I have several RNA-seq (stranded, PE, 30 million reads, 27 million aligned, mouse). I'm trying to check what happens after normalisation and you can see below that there are some differences in sequencing depth that are partly corrected after normalisation. However the last 6 samples don't align with the others. Am I looking at the right parameter to see if it was correctly normalized? If yes, does that mean normalisation is not good enough? why and can I improve it? thanks for your help,
I used the code below after DESEQ2 to generate the graphs (the not normalized just does not have normalized true
df2=data.frame(Tissu=colData$condition, Individu=rownames(colData),
               prof=colSums(counts(dds, normalized = TRUE)))
# Dataframe with depth (sum of reads)
# after normalisation.
png("Profondeur_apres_normalisation_tripl.png", 1000, 1000, pointsize=20)
ggplot(df2, aes(x=factor(Individu), y=prof, fill =Tissu))+
  geom_bar(stat ="identity") + xlab("Condition") + ylab("Profondeur")+
  theme(axis.text.x =element_text(angle = 90))
dev.off()

colSums is (imho) only partially informative towards how "well" normalization works. Exactly-aligned colSums are only expected if you normalize naively with reads per million as this will make colSums more or less equal. As DESeq2 (and edgeR) additionally correct for composition your plot could simply indicate that composition is different in these last samples. If you want to really "see" the normalization then make some MA-plots. The bulk of data points should be centered somewhat at y=0. The easiest would be to simply run the DESeq2 pipeline as normal and then use
plotMAon theresultsobject.