trackViewer peak visualization
1
0
Entering edit mode
@liruiradiant-8906
Last seen 2.2 years ago
United States

Hello Jianhong,

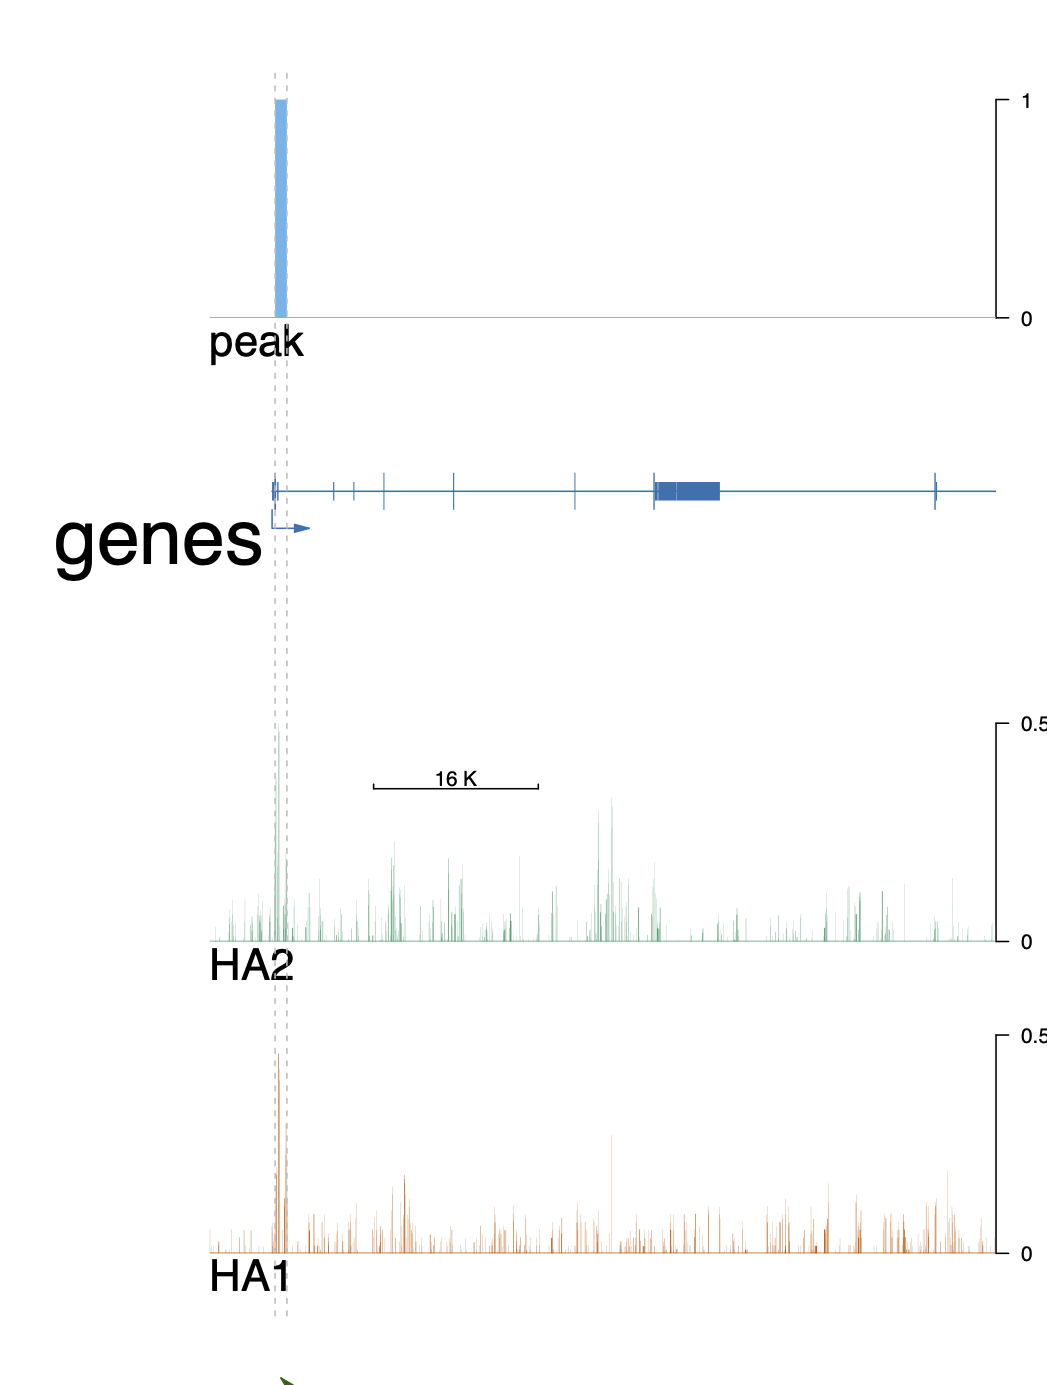
I intended to create trackView on ChIPSeq data align with the peak. I did not find a function in trackViewer to import peak.narrowPeak file, so I did the following

library(GenomicRanges)
peaks.gr <- parse2GRanges("chr9:69035856-69037005:+")
values(peaks.gr) <- DataFrame(score = c(1))
peak <- new("track", dat = trackViewer:::orderedGR(peaks.gr), type = "data", format = "BED")

Then I performed plotting, however, the peaks are not shown as what I intended, which is similar to an IGV peak visualization, or the exon visualization in trackViewer.

Is there a way to visualize peaks easily in trackViewer, e.g. a function to import bed/narrowPeak/broadPeak files?

Thanks a lot!! enter image description here

optSty <- optimizeStyle(trackList(HA1, HA2, genes, peak), theme="safe")
trackList <- optSty$tracks
viewerStyle <- optSty$style

setTrackViewerStyleParam(viewerStyle, "margin", c(.05, .2, .05, .05)) #bottom, left, top and right margin.
setTrackXscaleParam(trackList[[2]], "draw", TRUE)
setTrackXscaleParam(trackList[[2]], "gp", list(cex=0.8))
# setTrackXscaleParam(trackList[[2]], attr="position", 
#                     value=list(x=69035856, y=2, label=1000))
setTrackViewerStyleParam(viewerStyle, "xaxis", FALSE) # disable x ticks
setTrackStyleParam(trackList[[1]], "ylim", c(0, 0.5))
setTrackStyleParam(trackList[[2]], "ylim", c(0, 0.5))


vp <- viewTracks(trackList, 
                 gr=gr, viewerStyle=viewerStyle, 
                 autoOptimizeStyle=TRUE)

addGuideLine(c(69035856, 69037005), vp=vp) #peak1
addArrowMark(list(x=(69035856 + 69037005)/2,
                  y=2), # 2 means track 2 from the bottom.
             label="peak",
             col="darkgreen",
             vp=vp)
trackViewer • 1.2k views
ADD COMMENT
1
Entering edit mode
Ou, Jianhong ★ 1.3k
@ou-jianhong-4539
Last seen 6 days ago
United States

Hi,

Thanks for using trackViewer to plot your data. In current version of trackViewer, we don't have tracks for peak. There are two cheating methods you may want to try:

library(rtracklayer)
library(trackViewer)
extdata <- system.file("extdata", package="trackViewer",
mustWork=TRUE)
gr <- GRanges("chr11", IRanges(122929275, 122930122), strand="-")
fox2 <- importScore(file.path(extdata, "fox2.bed"), format="BED",
ranges=gr)
fox2$dat <- coverageGR(fox2$dat)
peaks <- GRanges("chr11", IRanges(c(122929350, 122929620, 122930050), width = 75), score=1)
## method 1, under the signal
fox2$dat2 <- peaks
## method 2, create a new track
peakTrack <- new("track", dat=peaks, type="data", format="BED")
## method 3, create a gene track
peaks$gene <- paste("peak", seq_along(peaks))
peaks$featureID <- peaks$gene
peaks$feature <- "CDS"
peakTrack2 <- new("track", dat=peaks, type="gene")
optSty <- optimizeStyle(trackList(fox2, peakTrack, peakTrack2,
                                  heightDist = c(10, .5, 1)), theme="safe")
trackList <- optSty$tracks
viewerStyle <- optSty$style
setTrackStyleParam(trackList[[1]], "color", c("brown", "green"))
viewTracks(trackList, gr=gr, viewerStyle = viewerStyle)

Jianhong.

ADD COMMENT
0
Entering edit mode

enter image description here

Looks much nicer now, thanks!!!

ADD REPLY
0
Entering edit mode

I used method2

ADD REPLY

Login before adding your answer.

Traffic: 704 users visited in the last hour
Help About
FAQ
Access RSS
API
Stats

Use of this site constitutes acceptance of our User Agreement and Privacy Policy.

Powered by the version 2.3.6