
Hello,
I need some guidance with finding the soft threshold for WGCNA. I have been following the tutorial and am up to the point where I design a red line that corresponds to using the R^2 cut off. I am using log (counts per million) normalized data using limma/voom for a large RNA seq experiment with many variables (including brain region, age, sex, genotype.) Limma voom is was necessary for this data set to account for the many variables. When constructing the tree diagram there are no major outliers in the data. My data does not reach the 0.9 threshold when plotting the data so the line does not fall within the graph. It seems that something is off with the power of the experiment and I am not sure how to proceed? Any help would be great! (code and graph below)
powers = c(c(1:10), seq(from = 12, to=20, by=2))
sft = pickSoftThreshold(datExpr0, powerVector = powers, verbose = 5)
sizeGrWindow(9, 5)
par(mfrow = c(1,2));
cex1 = 0.9;
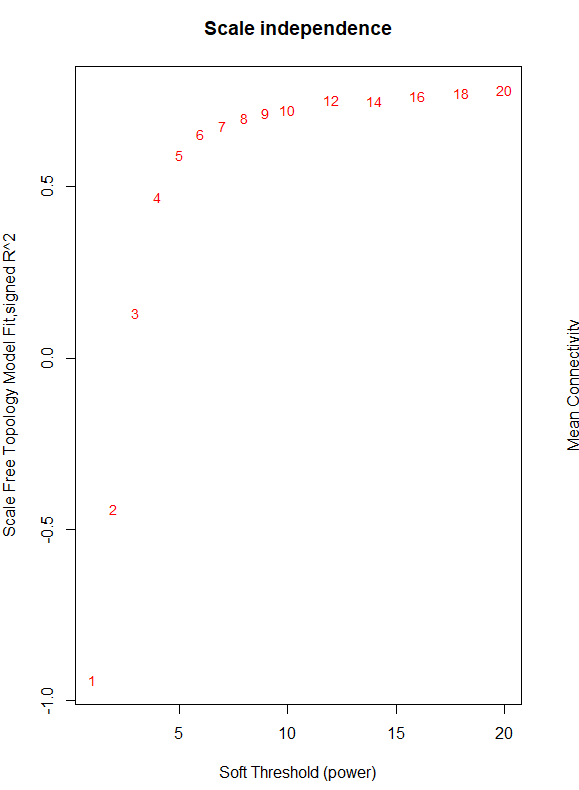
plot(sft$fitIndices[,1], -sign(sft$fitIndices[,3])*sft$fitIndices[,2],
xlab="Soft Threshold (power)",ylab="Scale Free Topology Model Fit,signed R^2",type="n",
main = paste("Scale independence"));
text(sft$fitIndices[,1], -sign(sft$fitIndices[,3])*sft$fitIndices[,2],
labels=powers,cex=cex1,col="red")
abline(h=0.90,col="red")
The output provides the following data and graph.
   Power SFT.R.sq  slope truncated.R.sq mean.k. median.k. max.k.
1      1    0.941  2.050          0.977  6530.0    6870.0   9170
2      2    0.442  0.415          0.735  3270.0    3440.0   5940
3      3    0.130 -0.196          0.559  1940.0    1970.0   4320
4      4    0.470 -0.535          0.736  1270.0    1220.0   3350
5      5    0.592 -0.753          0.811   884.0     795.0   2710
6      6    0.655 -0.900          0.855   644.0     539.0   2250
7      7    0.679 -1.020          0.875   486.0     377.0   1910
8      8    0.701 -1.110          0.891   376.0     270.0   1650
9      9    0.715 -1.180          0.904   297.0     196.0   1440
10    10    0.725 -1.250          0.910   239.0     145.0   1260
11    12    0.753 -1.350          0.930   162.0      83.1   1010
12    14    0.752 -1.450          0.927   114.0      50.1    820
13    16    0.763 -1.520          0.934    83.4      31.3    681
14    18    0.774 -1.570          0.943    62.5      19.8    574
15    20    0.781 -1.610          0.948    47.9      13.0    490
sessionInfo( )
```
I'm also analyzing my data using WGCNA. Not an expert. However, are you using all the genes or filter most variable genes? you can try filter most variable genes and run WGCNA again.
I am not sure if it is due to the fact that I am using pre-normalized data from my RNA-seq and not using fpkm but rather log counts per million