
Hello!
I am trying to understand how SNPRelate operates under the hood when samples have missing values.
Specifically, in my VCF I have 150 samples, split into 6 groups, 25 samples each (for each group, 10 samples were sequenced at 30x and 15 at 5x). When I conduct PCA (snpgdsPCA), I see samples cluster according to their groups, as follows:
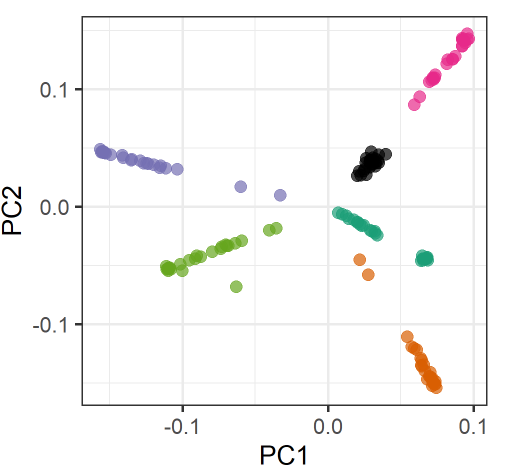
However, there is also a substructure within groups according to the sequence coverage (and therefore the missing rate).
This gives the PCA plot a star-like shape, where the 30x-samples form a blob towards the margins of the plot and the 5x-samples form a line towards the center of plot.
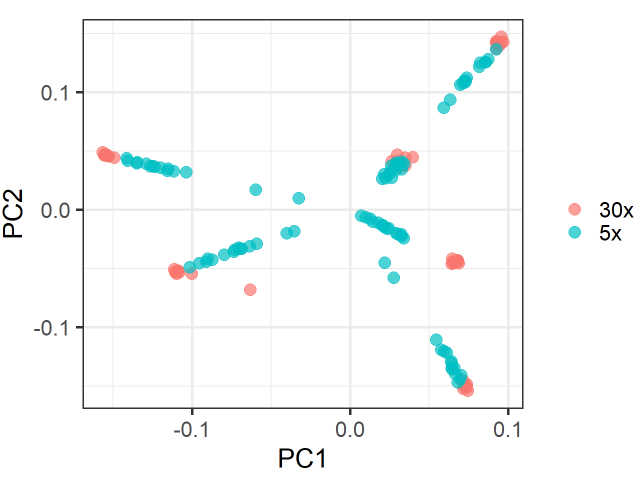
There is one group where this blob-line pattern does not occur (black-group). Samples in this group have much less missingness.
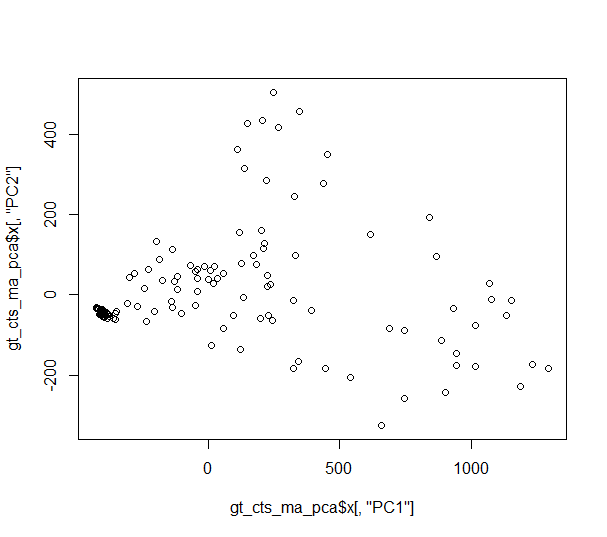
I try to replicate the PCA using the prcomp function in R, using the genotype count matrix I extract as follows:
seqVCF2GDS(vcf, "vcf.gds") #convert VCF to gds
genofile <- seqOpen("vcf.gds") # open gds
geno_cts <- read.gdsn(index.gdsn(genofile, "genotype/data")) # get allele counts (separated by chromosomes)

# Since for each SNP, there are two vectors with allele counts, add them up to get:
# homref = 0, het = 1, homalt = 2
# missing (.) encoded as 3, therefore, 6 = ./.
gt_cts_ma <- matrix(nrow = max(dim(geno_cts)), ncol = 150)

for(i in 1:max(dim(geno_cts))){
  gt_cts_ma[i,] <- geno_cts[,,i] %>% apply(2, sum)
}

colnames(gt_cts_ma) <- read.gdsn(index.gdsn(genofile, "sample.id"))

gt_cts_ma_pca <- prcomp(t(gt_cts_ma))

plot(gt_cts_ma_pca$x[,"PC1"], gt_cts_ma_pca$x[,"PC2"])
...but the plot does not resemble the SNPRelate PCA plot at all.
Looking at the function snpgdsPCA, the function gnrPCA is invoked, but I cannot find what it does anywhere.
Could you please tell me where I could learn more about the detailed steps used by snpgdsPCA in order to figure out what is behind the pattern I observe in my data?