Large DE LogFC range
1
0
Entering edit mode
save ▴ 20
@3d20f23f
Last seen 12 months ago
Italy

I'm working with DESeq2 to make a DE analysis between samples in two different conditions. During the analysis, I identified a batch effect due to the sequencing time modelled as a covariate in the design formula. From the differential expression (Wald test), I was able to retrieve a good number of significant genes (~100) but the LogFC range looks not reliable going from -30 to +30.

  • What could be the cause of these extreme large values and how can I solve the problem? I tried to use lfcShrink() to re-estimate the logFC but I'm not sure that is sufficient to achieve reliable results.
  • My second question is about the design of the model. Is it reasonable to add covariates to the model also if they don't show a strong effect on the data (looking PCA or clustering)?

Follow the code used for the analysis. Thanks for your help!


dds <- DESeqDataSetFromMatrix(count, coldata, design = ~ Group + Condition)

keep <- rowSums(counts(dds)) >= 10
dds <- dds[keep,]

dds <- DESeq(dds)

res <- results(dds, contrast=c("Condition","dis","hea"))
res <- res[which(res$padj <0.05),]
DESeq2 • 840 views
ADD COMMENT
0
Entering edit mode

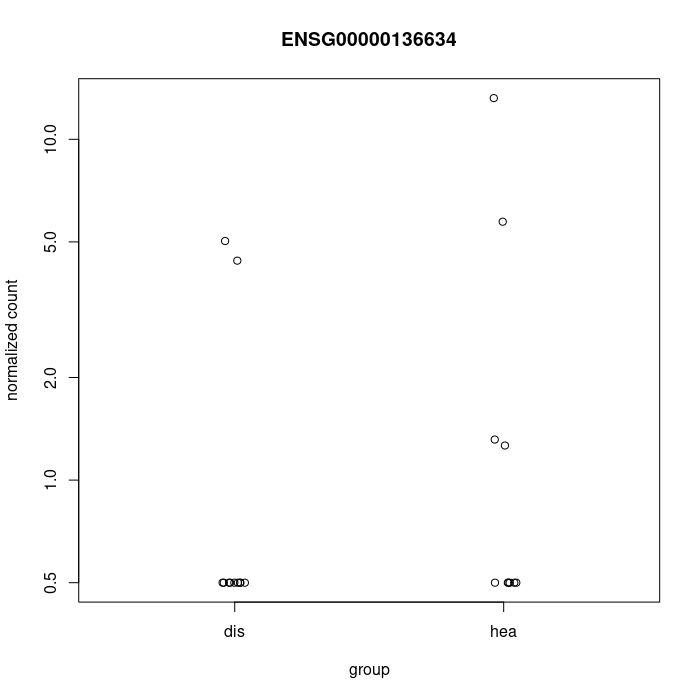
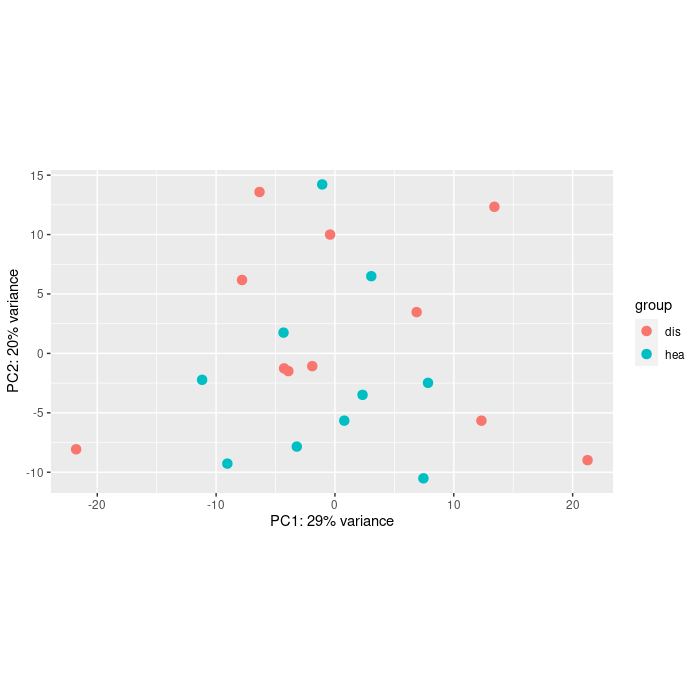
You could at least show some counts of the genes with large FCs. Also the PCA would help.

ADD REPLY
0
Entering edit mode
@mikelove
Last seen 14 minutes ago
United States

Agree with ATpoint, look at the genes with large LFC (from lfcShrink) using plotCounts. Usually large MLE LFC are from all 0's in one group.

"Is it reasonable to add covariates to the model also if they don't show a strong effect on the data"

This is up to the analyst. You can add them to be careful but it does come at a loss of degrees of freedom. So if they truly don't have any effect on any genes, it's best to leave out unnecessary covariates.

ADD COMMENT
0
Entering edit mode

Thanks for your comments. Regarding the large LFC, I checked the counts of the DE genes and seems that the majority of them is 0 in one condition while for other genes the expression level seems low in all the samples. I attached an example of plot of counts:

enter image description here

I also show the PCA plot colored by condition:

enter image description here

What do you suggest to do? Should I filter out more genes before to run DESeq()? Or is it enough to shrink the logFC?

ADD REPLY
0
Entering edit mode

Shrinking the LFC is the recommendation from the vignette.

We spent a lot of time developing and benchmarking the posterior estimates of LFC.

ADD REPLY

Login before adding your answer.

Traffic: 758 users visited in the last hour
Help About
FAQ
Access RSS
API
Stats

Use of this site constitutes acceptance of our User Agreement and Privacy Policy.

Powered by the version 2.3.6