I performed several differential gene expression analyses with edgeR (QLF) in which 2 groups were compared to each other.
In some comparisons, I noticed something I couldn't explain about the (adjusted) p-values. I am curious to know if this is normal and why this is happening. I noticed two things and will describe them below.
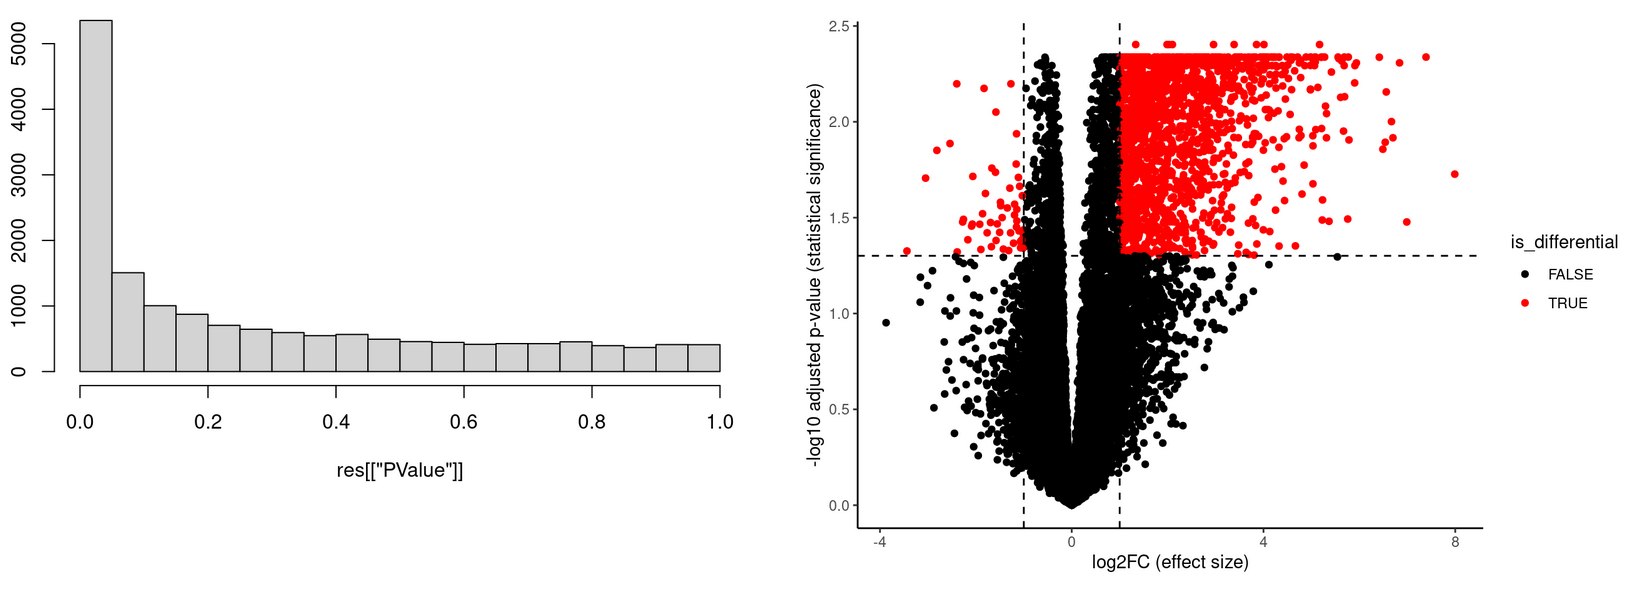
Image for the first observation:
The left panel shows a histogram of raw p-values as obtained by edgeR and the right panel shows a volcanoplot with the FDR (as outputted by edgeR) on the y-axis. I am wondering why many FDR values are numerically the same (on the right side of the volcano plot you see that many FDR values near the top are at the same horizontal position).
I think this is becaues the FDR value is calculated with p.adjust(, method = "BH") and that uses the cumulative minimum, but I am not sure.
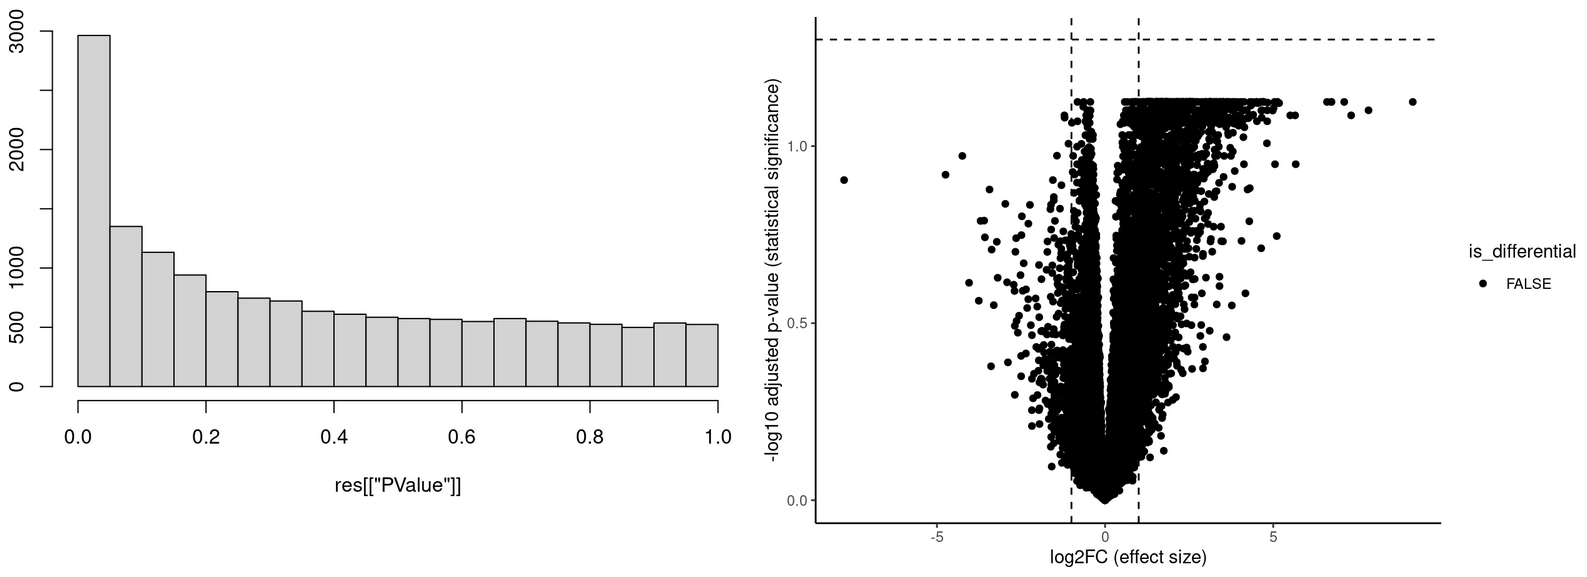
Image for the second observation:
These are the same types of graphs as in the first observation. Based on the histogram of p-values, I would expect at least some differentially expressed genes as low p-values seem to be enriched. Howerver, the is no gene with an FDR lower than 0.05. Based on the histogram, I didn't expect this and I have no idea why this is the case.
The fact that different p-values often map to the same FDR value is a consequence of the Benjamini & Hochberg algorithm. The mapping of p-value to FDR is monotonic but sometimes with steps. The phenomenon has been discussed and explained many times on this forum.
That is one of the reasons why I advise people not to make volcano plots with FDR as the vertical axis. If you must make a volcano plot, then use log-p as the vertical axis instead of log-FDR. I also advise people not to use fold-change cutoffs and to use mean-difference plots (plotMD) instead of volcano plots, because they are more informative in the context of empirical Bayes statistical tests.
Whether you get FDR < 0.05 is determined more by the size of the smallest p-values than by the shape of the p-value histogram.
Hello, thank you for this discussion, but I am puzzled : the mapping of the p-value can come with steps, but is that wrong ? I mean, you propose not to draw volcano plot with FDR in y axis, is that because in that case volcano plots are somewhat wrong, when they show dots aligned in steps ?
Best


Thank you very much for the information and advice.
Hello, thank you for this discussion, but I am puzzled : the mapping of the p-value can come with steps, but is that wrong ? I mean, you propose not to draw volcano plot with FDR in y axis, is that because in that case volcano plots are somewhat wrong, when they show dots aligned in steps ?
Best