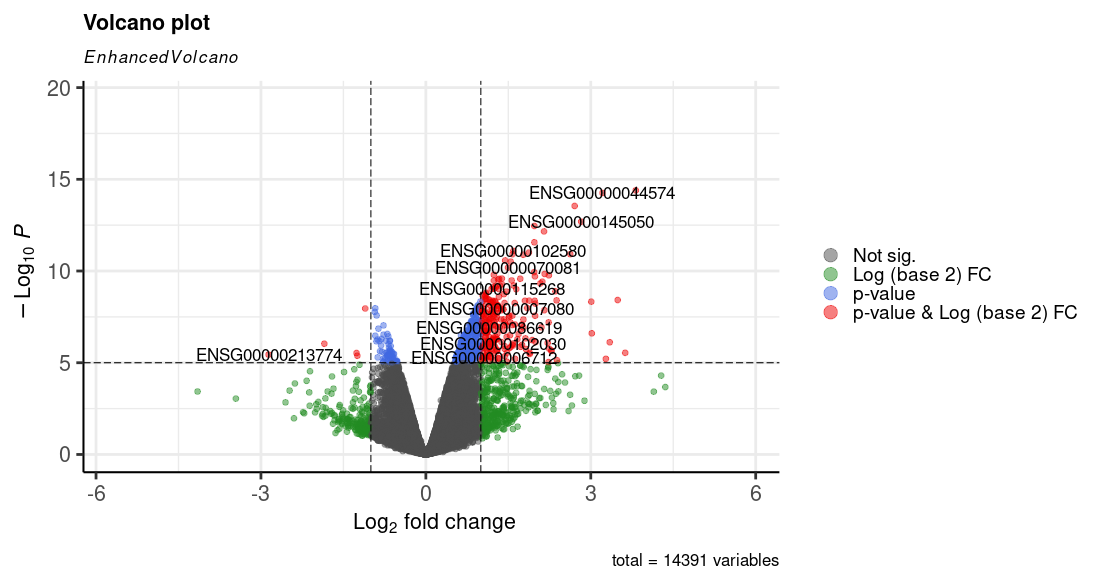
Hi all, the below is my volcano plot after EdgeR DGE analysis, plotted with p-value against log2FC.
The volcano plot however looks skewed with very little downregulated genes. What could be the issue here? I have filtered those with low counts using filterByExpr function and used estimateCommonDisp and qlf test for the calculation of log2FC.
Have you normalized the library sizes using calcNormFactors? I assume you have although you don't mention it. Failure to normalize would result in unbalanced DE.
Otherwise the plot is not necessarily wierd. It is perfectly possible to have more up-regulated than down-regulated genes as genuine biological result.
If you want to explore further, I suggest using an edgeR MD plot (plotMD), which IMO is more interesting and informative than a volcano plot.
If there really was a problem with the result, then you would have to show us your code for us to diagnose what the issue might be.