Entering edit mode

Hello everyone,
I am trying to visualize manually gated (FlowJo) flow cytometry data in R. So far, this is my current code:
#import FlowJo workspace and fcs files
ws <- open_flowjo_xml("~/DZNE/exp_data/LF018/LF018_FlowJo.wsp", full = T)
#select group and samples
gs <- flowjo_to_gatingset(ws, name = 1, subset = c(15, 17), execute = T)
#select gating
fs <- gs_pop_get_data(gs, "/HL-60/Single Cells/live", inverse.transform = T)
ggplot(fs, aes(x = `Comp-UV H 379_28-A`, fill = name)) +
    geom_density(aes(y= ..count..), alpha = 0.2) +
    scale_x_flowjo_biexp(maxValue = 262144, widthBasis = -100, pos = 4.42, neg = 0) +
    ylim(0,30) +
    theme_pubr() +
    theme(text = element_text(size = 12), legend.text = element_text(size = 12)) +
    theme(axis.title.y = element_text(margin = unit(c(0, 3, 0, 0), "mm")), axis.title.x = element_text(margin = unit(c(3, 0, 0, 0), "mm"))) +
    labs(
        x = "CD11b-A [AU]",
        y = "Count",
        fill = "Sample"
    )
The plot looks like this:
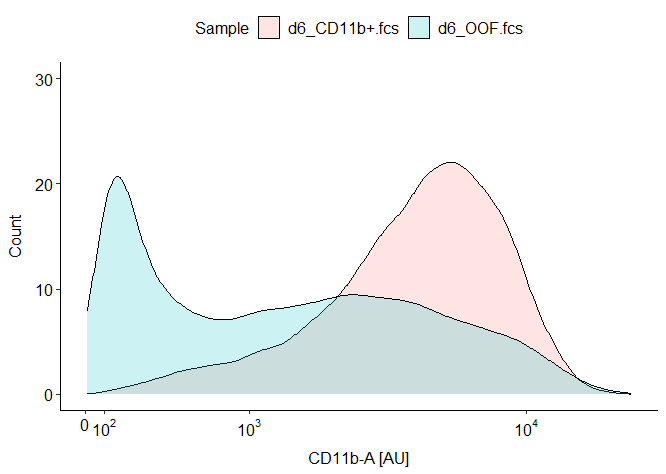
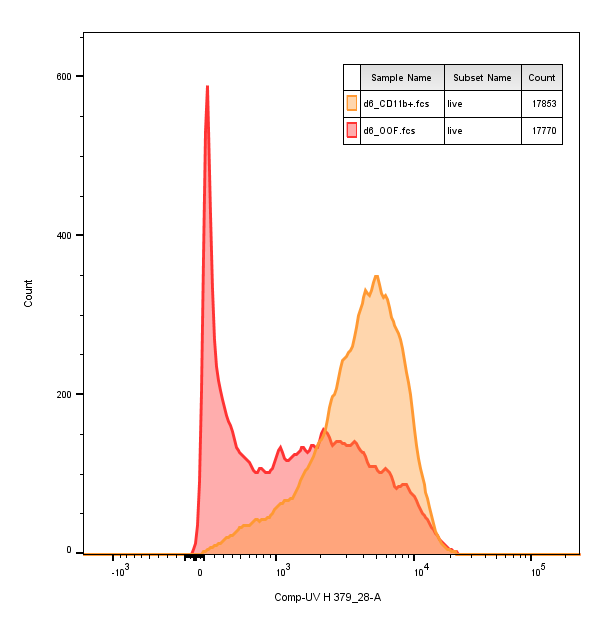
I find it quite puzzling that the count numbers on the y-axis are so low. Checking them with gs_pop_get_count reports about 2e4 counts per sample. Plotting in FlowJo with the exact same settings for the biexponential curve delivers two sharp peaks at around 600 cells and 400 cells, respectively.
Am I loosing cells?
Thank you for your help in advance!