Glad to see the question about SOX10 gene expression by legacy (hg19) and harmonized (hg38) in TCGA SKCM datasets. I adapted the code and did a test in April, 2022. Yes, a lot of things has changed, including the TCGAbiolinks package,TCGA GDC data, and wrinkles on my face. Thanks a lot for looking at other genes and ensuring there is a very strong correlation (pearsons correlation of >0.999) between the 2 datasets. I also noticed that there is another description about the legacy and harmonized TCGA data.
The expression values used here are both some kinds of raw counts:
- in legacy (hg19): "Estimated count by RSEM"
- in harmonized (hg38): "STAR - Counts"
Here is my code:
rm(list = ls())
ptm <- proc.time()
# proc.time() - ptm
options(stringsAsFactors = F)

# tidyverse tools
library("tidyverse")
tidyverse_packages()
library("magrittr")

# BiocManager::install("BioinformaticsFMRP/TCGAbiolinksGUI.data")
# BiocManager::install("BioinformaticsFMRP/TCGAbiolinks")

library("TCGAbiolinks")
library("SummarizedExperiment")

# Download and get the expression matrix data.

# harmonized data download
query.counts.SKCM.harmonized <- GDCquery(
    project = "TCGA-SKCM",
    data.category = "Transcriptome Profiling",
    data.type = "Gene Expression Quantification",
    workflow.type = "STAR - Counts",
    # barcode = c("TCGA-EB-A5VV-06A-11R-A32P-07", "TCGA-EE-A3AD-06A-11R-A18S-07"),
    legacy = FALSE
)

# legacy data download
query.counts.SKCM.legacy <- GDCquery(
    project = "TCGA-SKCM",
    platform = "Illumina HiSeq",
    experimental.strategy = "RNA-Seq",
    data.category = "Gene expression",
    data.type = "Gene expression quantification",
    file.type = "results",
    # barcode = c("TCGA-EB-A5VV-06A-11R-A32P-07", "TCGA-EE-A3AD-06A-11R-A18S-07"),
    legacy = TRUE
)

# Data download
GDCdownload(query.counts.SKCM.harmonized, method = "client", directory = file.path(getwd(), "GDCdata"))
GDCdownload(query.counts.SKCM.legacy, method = "client", directory = file.path(getwd(), "GDCdata"))

# GDCprepare download
SKCM.count.prep.harmonized  <- GDCprepare(query = query.counts.SKCM.harmonized, summarizedExperiment = TRUE)
SKCM.count.prep.legacy  <- GDCprepare(query = query.counts.SKCM.legacy, summarizedExperiment = TRUE)

# Get the expression matrix, gene x sample.
harmonized_matrix <- assay(SKCM.count.prep.harmonized)
legacy_matrix <- assay(SKCM.count.prep.legacy)

# Ensure the sample names are coherent between the hg19 and h38
stopifnot(identical(sort(colnames(harmonized_matrix)), sort(colnames(legacy_matrix))))

# Get the SOX10 expression vector in hg19 and hg38, respectively.

get_SOX10_gene_expression_harmonized <- function(the_matrix) {

    gene_name_vector <- the_matrix %>% rownames %>% str_replace(., pattern = ".[0-9]+$", replacement = "")
    sample_name_vector <- colnames(the_matrix)
    subset_matrix <- the_matrix[gene_name_vector == "ENSG00000100146", sort(sample_name_vector), drop = F]
    gene_expresion_vector <- subset_matrix[1, , drop = T]
}

get_SOX10_gene_expression_legacy <- function(the_matrix) {

    gene_name_vector <- the_matrix %>% rownames
    sample_name_vector <- colnames(the_matrix)
    subset_matrix <- the_matrix[grepl(pattern = "SOX10|6663", gene_name_vector), sort(sample_name_vector), drop = F]
    gene_expresion_vector <- subset_matrix[1, , drop = T]
}

SOX10_expression_harmonized_vector <- harmonized_matrix %>% get_SOX10_gene_expression_harmonized
SOX10_expression_legacy_vector <- legacy_matrix %>% get_SOX10_gene_expression_legacy

# Visualize the SOX10 expression.

pdf(file = "SOX10_expression.pdf")

par(mfrow = c(2, 2))
options(scipen = 999)

# histogram
hist(SOX10_expression_legacy_vector, main = "SOX10 legacy (hg19)", xlab = "Estimated count by RSEM")

# histogram
hist(SOX10_expression_harmonized_vector, main = "SOX10 harmonized (hg38)", xlab = "STAR - Counts")

# scatter plot
plot(x = SOX10_expression_legacy_vector,
     y = SOX10_expression_harmonized_vector,
     cex = 0.5,
     frame.plot = F,
     xlab = "SOX10 expression legacy (hg19)",
     ylab = "SOX10 expression harmonized (hg38)",
     main = "SOX10 legacy vs harmonized")
# Add fit lines
# regression line (y ~ x)
abline(lm(SOX10_expression_harmonized_vector ~ SOX10_expression_legacy_vector), col = "green")
# lowess line (x, y)
lines(lowess(SOX10_expression_legacy_vector, SOX10_expression_harmonized_vector), col = "violet")

# multiple-line graph
plot(sort(SOX10_expression_legacy_vector),
     type = "o",
     cex = 0.5,
     pch = 1,
     col = "red",
     lty = 1,
     frame.plot = F,
     xlab = "samples",
     ylab = "expression",
     main = "SOX10 legacy and harmonized")
lines(SOX10_expression_harmonized_vector[names(sort(SOX10_expression_legacy_vector))],
      type = "o",
      lty = 1,
      cex = 0.5,
      pch = 2,
      col = "blue")
# add legend
legend("bottomright",
       col = c("red", "blue"),
       pch = c(1, 2),
       lty = 1,
       legend = c("legacy (hg19)", "harmonized (hg38)"),
       bty = "n"
       )

dev.off()

proc.time() - ptm
Here is the plot of the result:
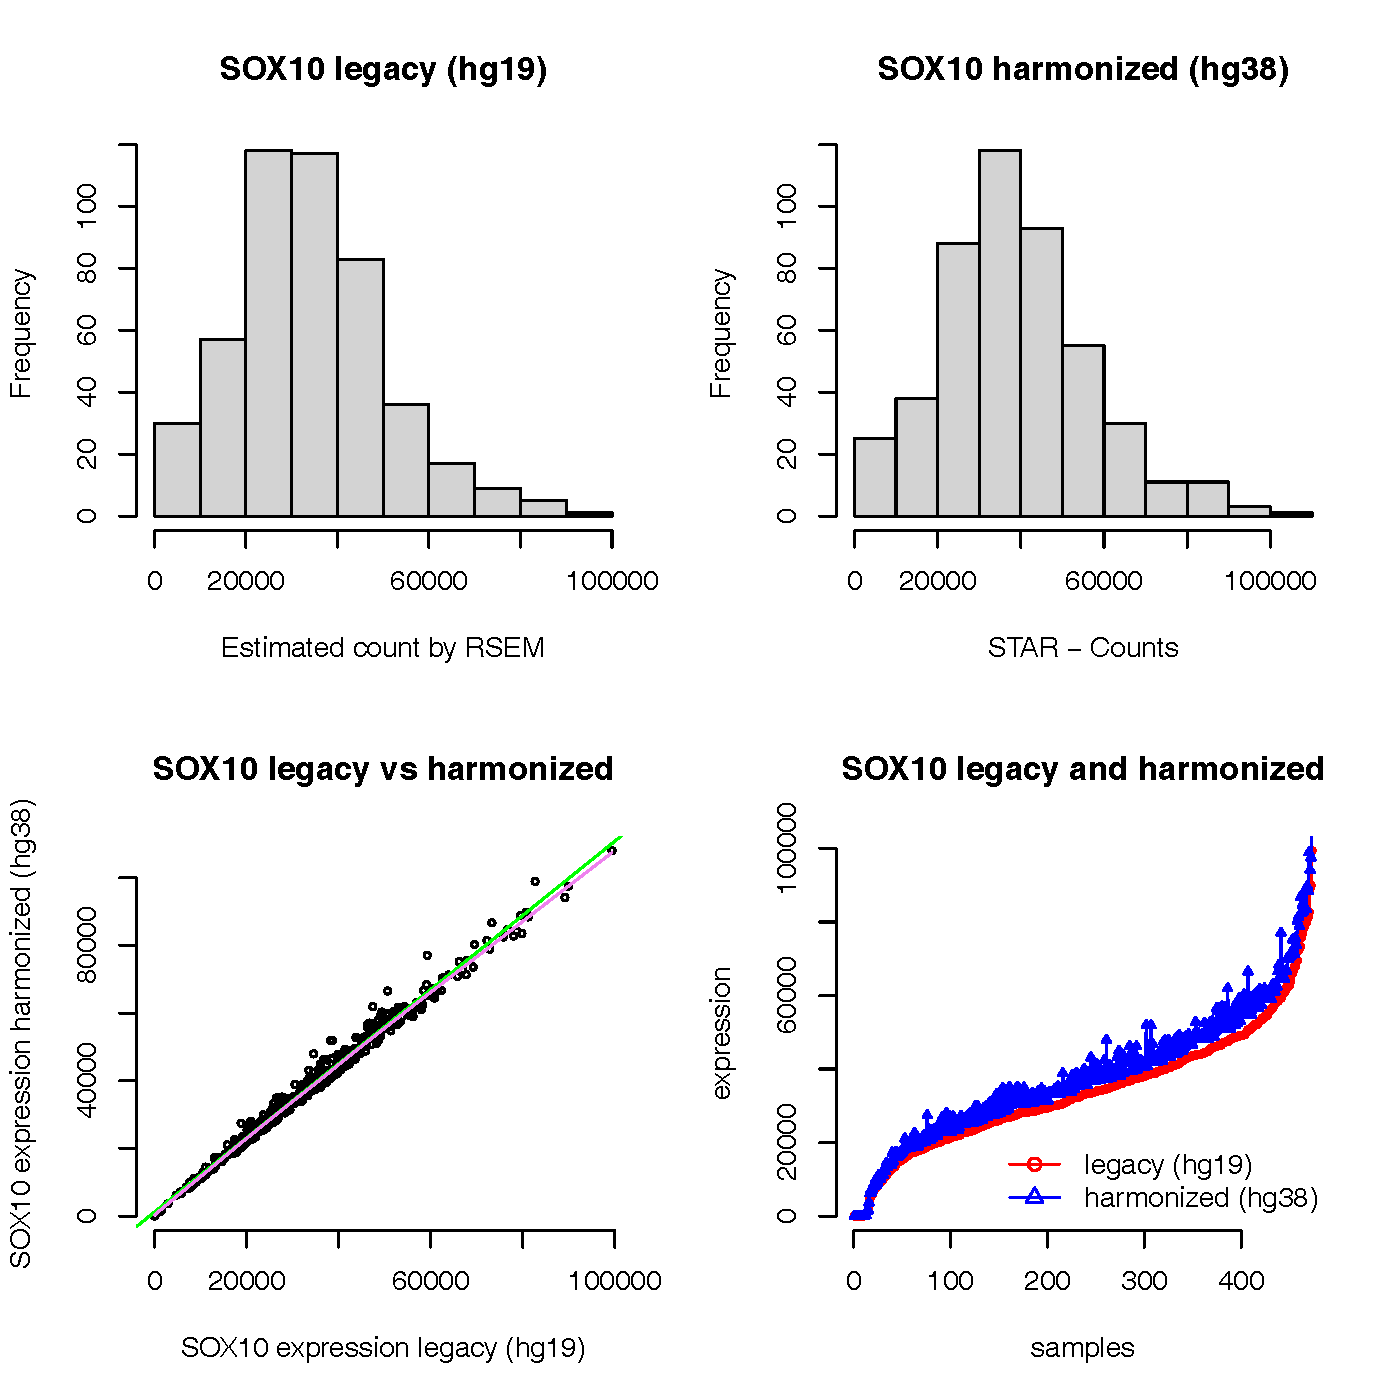
From the graph, we can see that the expression values of SOX gene in legacy (hg19) and harmonized (hg38) look very normal and consistent. The expression values of SOX gene in harmonized (hg38) seem not zero count for all samples in my test results.


