Large difference in PCA plot based on LCPM (log counts per million) and VST (variance stabilizing transformations)
1
0
Entering edit mode
Alan • 0
@2ef0a305
Last seen 23 months ago
United States

Hello,

Recently, I am learning the RNA-seq analysis, especially for PCA in order to check if the control and treatment can separate based on the treatment condition. I checked online for preparing the data before performing the PCA. I got an idea that, LCPM calculated from raw count matrix can be used as the PCA input and I did it the my first PCA method below. The resulting PCA can separate between control and treatment (see the figure here: enter image description here). When I learn the DESeq2 tutorial (http://bioconductor.org/packages/devel/bioc/vignettes/DESeq2/inst/doc/DESeq2.html), I got that PCA can also be performed based on VST transformation as I did in the method 2 below. However, by using the vst based method, this time the PCA can not separate (see the figure here: enter image description here) between control and treatment though all the data are same.

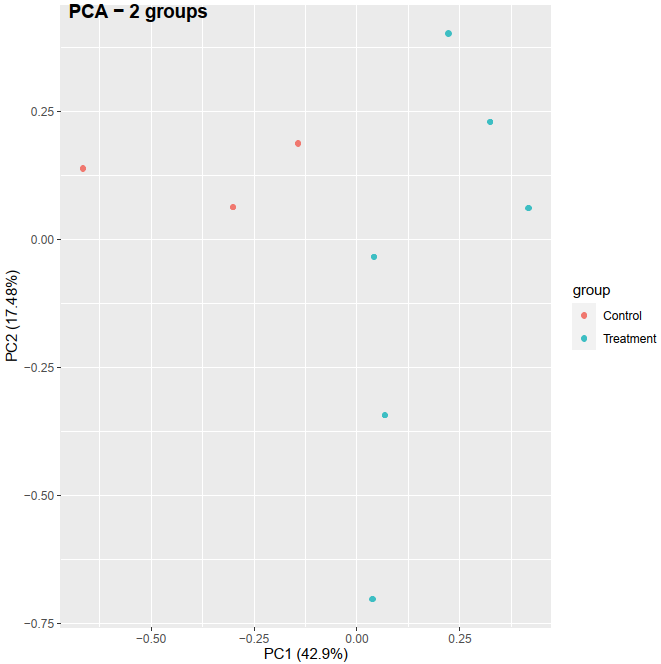
Can you give suggestions which method (LCPM or VST) should I used in this case? Why are different in PCA based on the different data transformation? In this case which data transformation method should I use? Or based on the PCA methods I tried, can it indicate that my RNA-seq data is hard to separate based on treatment from control?

Any suggestion are appreciated!

Some key codes are listed below.


# Method 1: PCA based on LCPM
y <- readDGE(files, columns = c(1, 3))
lcpm <- cpm(y, log = TRUE)
dat <- t(lcpm)
pca_res <- prcomp(dat, scale. = TRUE)
autoplot(pca_res, data = dat_org, colour = 'group')
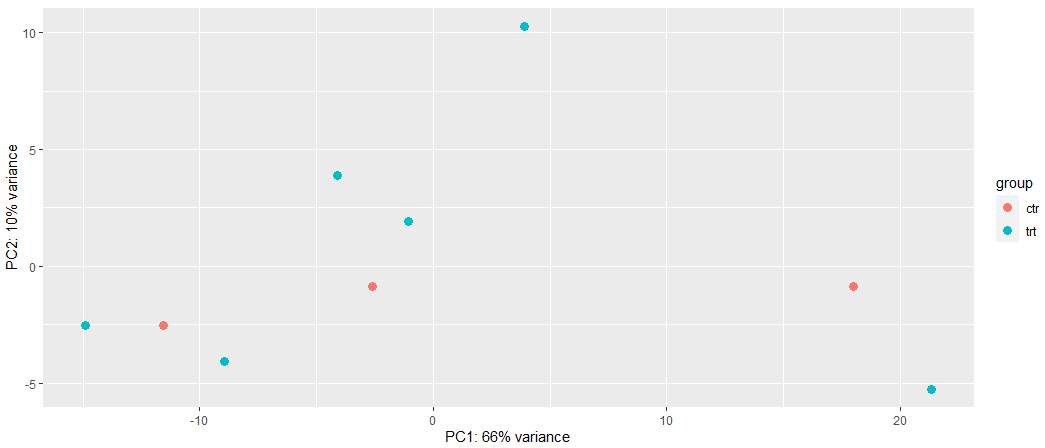
# Method 2: VST
dds <- DESeqDataSetFromMatrix(countData = cts,
                              colData = coldat, 
                              design = ~ condition)
vsd <- vst(dds, blind = FALSE)
plotPCA(vsd, intgroup = c("condition"))
PCAtools edgeR pcaExplorer RNASeq RNAseq123 • 2.4k views
ADD COMMENT
2
Entering edit mode

This is not like-for-like. In the first PCA you use all genes and even scale them while the second one uses the top 500 most variable genes wihout scaling. These differences are stronger than the vst/logcpm difference. Vst or logcpm, in my experience it really does not matter too much but be sure to do the PCA correctly as in here it's inconsistent.

ADD REPLY
0
Entering edit mode

ATpoint Thanks so much. Now, I understand that 'scale' and 'top 500 most variables' play an import role in the different result in my case.

May I ask one more question, should I do the scaling operation before performing PCA in the method 01? I noted that, by doing scaling, control and treatment can separate in PC1, while without doing scaling, then control and treatment can separate in PC2.

As you mentioned "be sure to do the PCA correctly", can you help give the suggestions what is the corrected way to do PCA for RNA-Seq data?

Thanks.

ADD REPLY
1
Entering edit mode

Please follow the edgeR user guide on PCA/MDS exactly unless you have expert knowledge to confidently change anything they suggested. DESeq2 is another option, excellent user guide as well.

ADD REPLY
0
Entering edit mode

Thanks ATpoint I will do that.

ADD REPLY
2
Entering edit mode
@gordon-smyth
Last seen 7 hours ago
WEHI, Melbourne, Australia

The cpm() function is part of the edgeR package pipeline for RNA-seq. The standard way to make a PCA plot in the edgeR pipeline would be:

y <- readDGE(files, columns=c(1, 3))
keep <- filterByExpr(y, group=group)
y <- y[keep,,keep.lib.size=FALSE]
y <- calcNormFactors(y)
plotMDS(y, label=group)

Note here that you do need to filter out unexpressed genes (by filterByExpr) and normalize the libraries sizes (by calcNormFactors) but you should not be doing any scaling. The plotMDS function computes the log-CPM values internally, but you can also extract them yourself and get the same result by:

logCPM <- cpm(y, log=TRUE)
plotMDS(logCPM, label=group)

More information can be found in the edgeR workflow.

ADD COMMENT
0
Entering edit mode

Thanks Gordon Smyth . Yes, I did the filtering before performing PCA, but I did NOT normalized the libraries size by calcNormFactors before PCA. Is 'performing calcNormFactors' a must-do step before PCA?

I compared the PCA results between without preforming calcNormFactors and with performing calcNormFactors, and I found that after performing calcNormFactors, the PCA can not separate treatment from control anymore.

Thanks.

ADD REPLY

Login before adding your answer.

Traffic: 843 users visited in the last hour
Help About
FAQ
Access RSS
API
Stats

Use of this site constitutes acceptance of our User Agreement and Privacy Policy.

Powered by the version 2.3.6