Meaning of brown-coloured nodes in the graph produced by the ReactomePA viewPathway() function.
0
0
Entering edit mode
@charlesgwellem-16293
Last seen 2.0 years ago
Germany

Hi. I understand from the legend of the plot below that the colouration of nodes from red through blue reflects fold change. But what does the node coloured in brown represent?

enter image description here

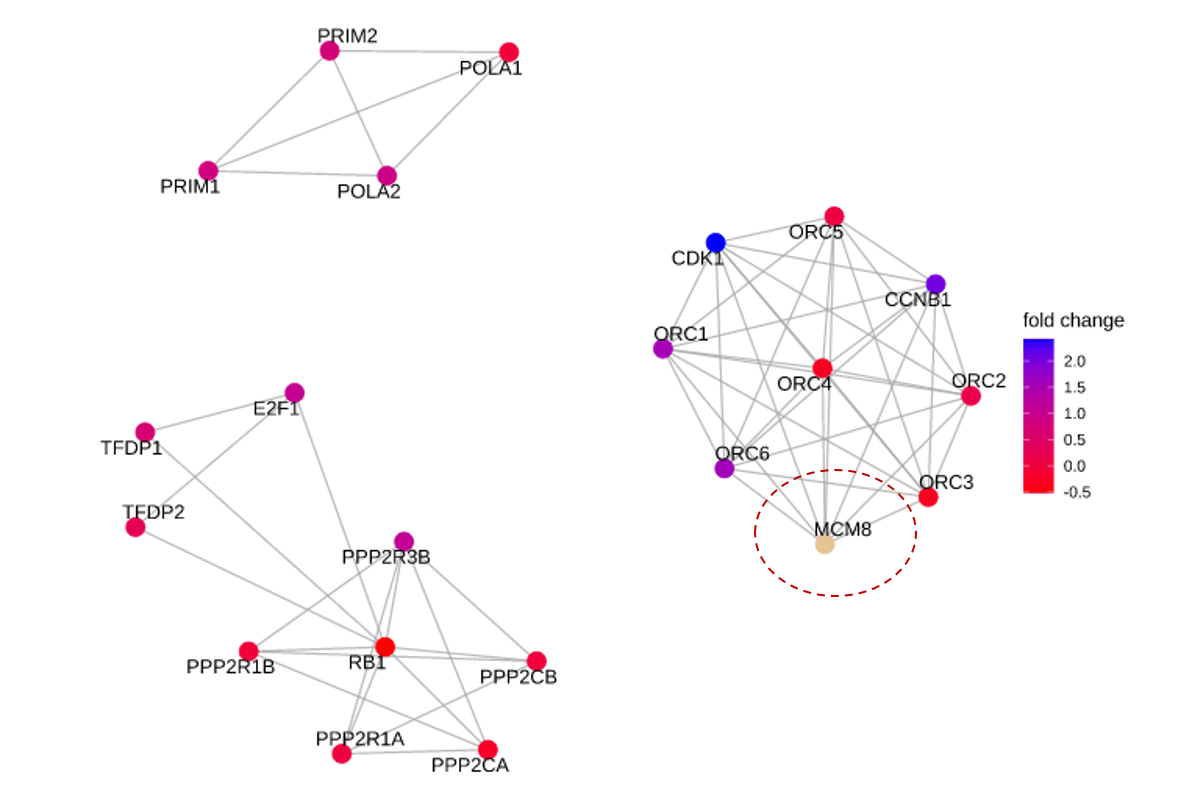
The figure above is derived from the code below


viewPathway("E2F mediated regulation of DNA replication", 
            readable = TRUE, 
            foldChange = geneList)
clusterProfiler ReactomePA • 627 views
ADD COMMENT
1
Entering edit mode

I think this is because MCM8 is absent from the geneList example so there is no FC information

ADD REPLY

Login before adding your answer.

Traffic: 983 users visited in the last hour
Help About
FAQ
Access RSS
API
Stats

Use of this site constitutes acceptance of our User Agreement and Privacy Policy.

Powered by the version 2.3.6