
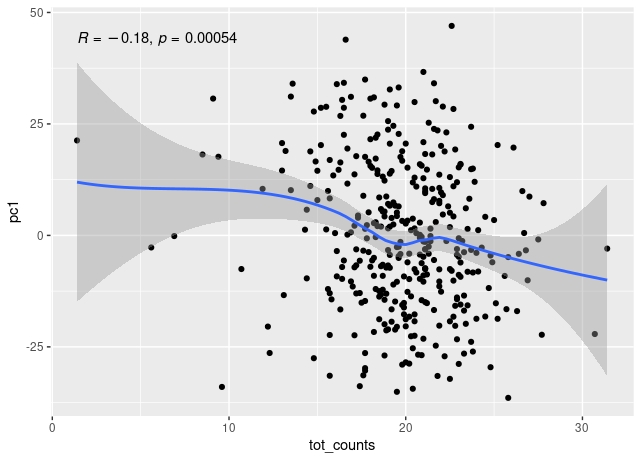
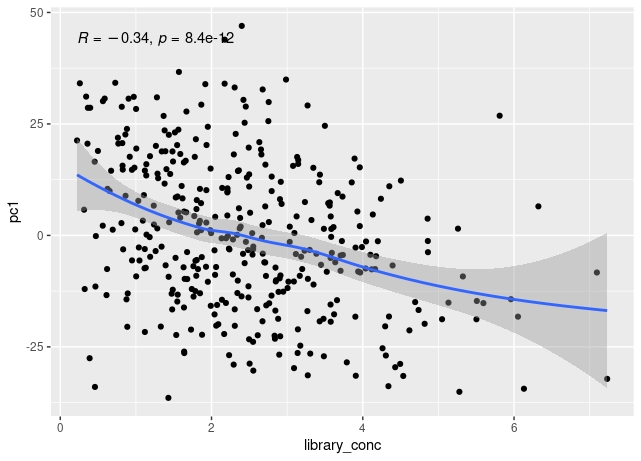
The first principal component of variance stabilised transformed RNA-seq data for 350 whole blood samples shows some correlation with total read count for sample, and also with library concentration for sample.
The PCA analysis is performed on read abundance summarized to gene data processed by vst() in DESeq2, which I understand is correcting for sequence depth. So why does this correlation remain? Is it indicative of a problem with the sequencing, or expected for clinical samples (because RNA concentration might relate to real variation eg in how unwell patients are), or have I misunderstood what DESeq2 is doing in the vst function?
The correlation remains when low count outliers are removed.
Full disclosure, I asked a related question on biostars, sorry if this is not the right place to post.
se <- tximeta(coldata = coldata)
gse <- summarizeToGene(se)
total_counts_by_sample <- round( colSums(assay(gse)) / 1e6, 1 )
# make DESeq object
dds <- DESeqDataSet(gse,
                    design = ~ x1
                    )
# filter zero count genes
keep <- rowSums(counts(dds)) > 1
dds <- dds[keep,]
# variance stabilising transform
vsd <- vst(dds, blind = FALSE)

rv <- rowVars(assay(vsd))
select <- order(rv, decreasing = TRUE)[seq_len(min(500, length(rv)))]
pca <- prcomp(t(assay(vsd)[select, ]))

# PC1 ~ total read count (millions)
stack(pca$x[,1]) %>%
  dplyr::rename(pc1 = values) %>%
  left_join(
    stack(total_counts_by_sample) %>%
      dplyr::rename(tot_counts = values),
    by = "ind"
  ) %>%
  ggplot(
    aes(tot_counts, pc1)
  ) +
  geom_point() +
  geom_smooth() +
  stat_cor()

# PC1 ~ library concentration (metadata)
stack(pca$x[,1]) %>%
  dplyr::rename(pc1 = values) %>%
  left_join(
    coldata %>%
      transmute(
        ind = names,
        library_conc = library_conc_q),
    by = "ind"
  ) %>%
  ggplot(
    aes(library_conc, pc1)
  ) +
  geom_point() +
  geom_smooth() +
  stat_cor()

Thanks very much again for this reply Michael Love .
The correlation of PC1 with total counts is robust to outliers - either by excluding them or by using a rank sum correlation (~r=0.15). But clear that correlation PC1 with library concentration is much stronger. Also, total counts and library concentration are correlated (~r=0.4).
What genes contribute to PC1?
Top 25 genes are:
"solute carrier family 4 member 1 (Diego blood group) ", "nuclear factor I X ", "solute carrier family 25 member 39 ", "ankyrin 1 ", "X-linked Kx blood group ", "NEDD4 like E3 ubiquitin protein ligase ", "potassium voltage-gated channel subfamily H member 2 ", "Y-box binding protein 3 ", "hydroxyacylglutathione hydrolase ", "ferrochelatase ", "spectrin beta, erythrocytic ", "insulin like growth factor 2 mRNA binding protein 2 ", "muscleblind like splicing regulator 3 ", "RAP1 GTPase activating protein ", "tensin 1 ", "STE20 related adaptor beta ", "hemoglobin subunit theta 1 ", "acetylcholinesterase (Cartwright blood group) ", "SRR1 domain containing ", "F-box protein 7 ", "pleckstrin 2 ", "NPR3 like, GATOR1 complex subunit ", "G1 to S phase transition 1 ", "GDP-L-fucose synthase ", "BCL2 interacting protein 3 like "
Top 12 PC1 genes by library concentration
These appear to be genes related to red blood cells (RBC), perhpas those not removed by globin RNA reduction; enriched GO terms on top 100 genes from PC1 agrees:
"oxygen transport", "hydrogen peroxide catabolic process", "gas transport", "hydrogen peroxide metabolic process", "erythrocyte differentiation", "erythrocyte homeostasis", "myeloid cell homeostasis", "myeloid cell development", "cellular oxidant detoxification", "cellular detoxification", "bicarbonate transport", "cellular response to toxic substance", "detoxification", "reactive oxygen species metabolic process", "homeostasis of number of cells", "heme biosynthetic process", "response to toxic substance", "porphyrin-containing compound biosynthetic process", "tetrapyrrole biosynthetic process", "heme metabolic process", "pigment biosynthetic process", "porphyrin-containing compound metabolic process", "pigment metabolic process"
Interpretation?
PC1 correlates with haemoglobin level in blood (which is a proxy for red cell count), although not significantly with library concentration:
One interpretation would be that PC1 is capturing real biological variation in red cell mRNA. This is a critically-ill patient population who have higher than normal variance in red cell count / haemoglobin (ie anaemia is common), and likely higher proportion of immature RBCs in whole blood (reticulocytes). Sicker patients might just have less cellular blood (+/- less mRNA per cell in blood), and this might impact differentially on subsets of genes (e.g. RBC v WBCs)?
Is a similar PC visible in other published critically-ill patient cohorts?
If the above interpretation is correct it should be that a major PC in RNA-seq counts relating to both RBC transcripts and to library concentration is visible in other critically-ill patient studies. Searching NCBI GEO manually for datasets with 1. Critically-ill inpatients, 2. RNA-seq whole blood with globin reduction first three I found were a sepsis, a candidaemia, and an acute pancreatitis study. Library concentration was not available, but total read counts were calculated. In all 3, either the first or second PC related to total read count and to RBC physiology, with several same genes as seen in PC1 above (shown below).
Baghela sepsis cohort GSE185263 https://doi.org/10.1016/j.ebiom.2021.103776
Top 25 genes PC1:
"solute carrier family 4 member 1 (Diego blood group) ", "TNF receptor superfamily member 17 ", "Y-box binding protein 3 ", "spectrin beta, erythrocytic ", "RAP1 GTPase activating protein ", "tensin 1 ", "STE20 related adaptor beta ", "sialic acid binding Ig like lectin 1 ", "derlin 3 ", "POU class 2 homeobox associating factor 1 ", "otoferlin ", "interleukin 1 receptor type 2 ", "syndecan 1 ", "arginase 1 ", "cysteine rich transmembrane module containing 1 ", "6-phosphofructo-2-kinase/fructose-2,6-biphosphatase 2 ", "family with sequence similarity 210 member B ", "solute carrier family 6 member 8 ", "joining chain of multimeric IgA and IgM ", "carbonic anhydrase 1 ", "integral membrane protein 2C ", "tropomodulin 1 ", "hemogen ", "annexin A3 ", "selenium binding protein 1 "
GO terms PC1:
"myeloid cell development", "erythrocyte differentiation", "erythrocyte homeostasis", "myeloid cell homeostasis", "homeostasis of number of cells", "negative regulation of protein polymerization"
Steinbrink candidaemia Genome Med 2021 PMID: 34225776 GSE176260
Top 25 genes PC1:
"solute carrier family 4 member 1 (Diego blood group) ", "nuclear factor I X ", "lactotransferrin ", "solute carrier family 25 member 39 ", "ankyrin 1 ", "X-linked Kx blood group ", "NEDD4 like E3 ubiquitin protein ligase ", "Y-box binding protein 3 ", "ferrochelatase ", "spectrin beta, erythrocytic ", "insulin like growth factor 2 mRNA binding protein 2 ", "muscleblind like splicing regulator 3 ", "RAP1 GTPase activating protein ", "tensin 1 ", "STE20 related adaptor beta ", "hemoglobin subunit theta 1 ", "acetylcholinesterase (Cartwright blood group) ", "sialic acid binding Ig like lectin 1 ", "cell division cycle 34, ubiqiutin conjugating enzyme ", "F-box protein 7 ", "pleckstrin 2 ", "RIO kinase 3 ", "G1 to S phase transition 1 ", "GDP-L-fucose synthase ", "BCL2 interacting protein 3 like "
GO terms PC1:
"erythrocyte development", "erythrocyte differentiation", "erythrocyte homeostasis", "myeloid cell development", "myeloid cell homeostasis", "hydrogen peroxide catabolic process", "hydrogen peroxide metabolic process", "homeostasis of number of cells", "myeloid cell differentiation", "porphyrin-containing compound metabolic process", "bicarbonate transport", "killing of cells of other organism", "antimicrobial humoral response", "tetrapyrrole metabolic process", "heme metabolic process"
Dhillon Acute Pancreatitis GSE194331 doi: 10.1097/XCS.0000000000000115
Top 25 genes PC2:
"solute carrier family 4 member 1 (Diego blood group) ", "integrin subunit alpha 2b ", "ETS variant transcription factor 7 ", "lactotransferrin ", "lysine demethylase 5D ", "solute carrier family 25 member 39 ", "solute carrier family 38 member 5 ", "ankyrin 1 ", "X-linked Kx blood group ", "Y-box binding protein 3 ", "DEAD-box helicase 3 Y-linked ", "zinc finger protein Y-linked ", "spectrin beta, erythrocytic ", "insulin like growth factor 2 mRNA binding protein 2 ", "RAP1 GTPase activating protein ", "tensin 1 ", "STE20 related adaptor beta ", "small integral membrane protein 24 ", "protein kinase Y-linked (pseudogene) ", "pleckstrin 2 ", "myosin light chain 9 ", "NPR3 like, GATOR1 complex subunit ", "Kruppel like factor 1 ", "RUN domain containing 3A ", "secreted protein acidic and cysteine rich "
GO terms PC2:
"myeloid cell development", "erythrocyte development", "erythrocyte differentiation", "erythrocyte homeostasis", "hydrogen peroxide catabolic process", "myeloid cell differentiation", "hydrogen peroxide metabolic process", "myeloid cell homeostasis", "gas transport", "blood coagulation", "hemostasis", "coagulation", "platelet degranulation", "bicarbonate transport", "homeostasis of number of cells", "platelet activation", "regulation of body fluid levels", "wound healing", "platelet aggregation"
Conclusion
I think PC1 probably represents real biological variation, related to critical-illness variation in cellularity of whole blood, particularly residual RBC mRNA. I'm unclear if this might still be a potential bias in differential expression analysis (a residual denominator fallacy?) and would be keen to hear any thoughts from bioinformaticicians or other experts!
If you want to control for library concentration or residual RBC amount during DE, the best approach would be to add it into the design. If it explains variance in counts it will account for that -- and if it isn't relevant you don't lose much power with the loss of one degree of freedom.
Great suggestion thanks again Michael Love
Thank you very much for this really fast and helpful reply. Will work through suggestions and report back (in case useful to others), and then accept answer.