
I have a data from a large proteomics study from 237 patients. It is a time course (days 1, 4, 8, 15 and 29) in two treatments: drug and placebo. The data were collected in several batches. We know age and sex of each patient.
Initially I run limma using a model
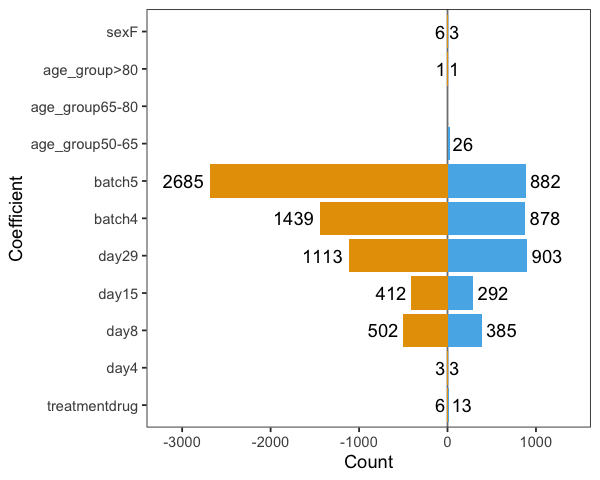
~ treatment + day + batch + age_group + sex
It shows very strong batch effects. The figure below shows the numbers of statistically significant proteins (going up - blue, and down - orange) at FDR < 0.01 level:
However, I found that age and sex distribution is significantly different between the batches, so I want to include interaction terms. When I use a model
"~ treatment + day + batch * (age_group + sex)
batch effects suddenly almost disappear.
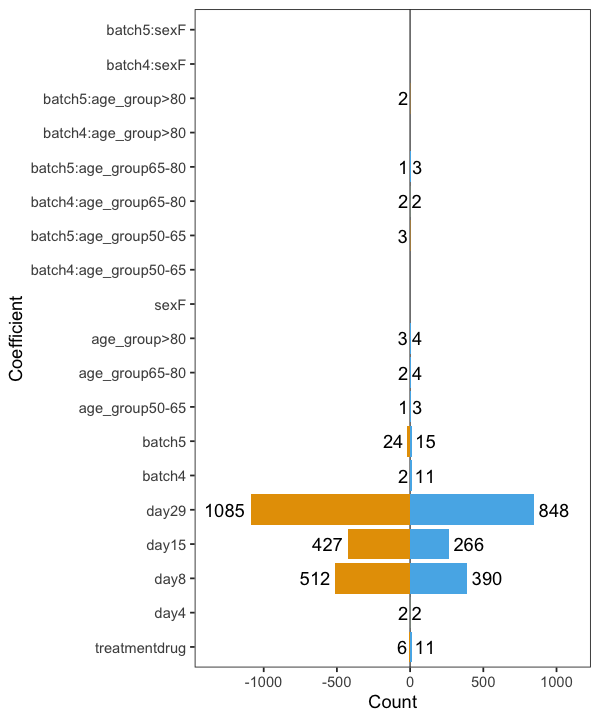
This is very nice and, if batch effects are caused by age and sex distribution, that would explain my data. On the other hand, the interaction terms contain only a few significant proteins.
I am worried that at this point I am overfitting the data with too many coefficients and the model is too good to be true. Is there a way of finding if the model overfits data in limma?
Note: the input for limma is a matrix with 237 columns (samples) and 5839 rows (proteins). As data are confidential, I cannot present all of it here.

Thank you, Gordon. Is there any formal way of comparing "full" and "reduced" models in limma? In linear regression one can find SSE and d.o.f. for each model and perform an F-test. If I understand correctly, lmFit fits a linear model to each gene. Is it possible to get a summary statistic for all models analogous to F in one regression?
In limma, you do an F-test simply by specifying multiple coeffcients to
topTable. limma then does an F-test for all the specified coefficients. The "full" model if the one with all the coefficient in. The "reduced" model is the one with all the specified coeffcients removed, or set to zero. If you want an F-test for the overall model, then specify all the coefficents (excluding the intercept).By the way, I looked at the distribution of p-values in both models, and while the simpler model gives nice uniform distributions with some excess in small values, in the complex model age, sex and interaction terms have a reversed p-value distribution - increasing towards larger values. This seems to confirm that the complex model is not appropriate here.