DESeq2 how to specify contrast to test difference of differences
2
0
Entering edit mode
Nicole ▴ 10
@cd7563ba
Last seen 15 months ago
United States

I am trying to take the "difference of differences" in contrasts from two factors (sex and group). We have male and female animals (sex factor) that were untrained or trained for 1, 2, 4, or 8 weeks (group factor, i.e., "control", "1w", "2w", "4w", "8w"). I want to know the difference in the training effect at each time point between the two sexes.

Conceptually, this is what I want at the 1-week time point, for example:

(male:1w - male:control) - (female:1w - female:control)

However, I can't figure out how to do this in DESeq2. Specifying this contrast in limma would be straightforward, but I want to use DESeq2 for consistency with other arms of the differential analysis. I have looked at other answers here and here as well as the Interactions section of the DESeq2 tutorial, but I am still perplexed.

I have tried specifying the contrast with an interaction term (i.e. ~ sex*group) as well as with a new factor that pastes together the sex and group factors. I feel like I got the closest with the interaction term:

dds <- makeExampleDESeqDataSet(n=50,m=100)
dds$sex <- factor(rep(c("male","female"), each=25))
dds$group <- factor(rep(c("control","1w","2w","4w","8w"), 10))
# define reference levels 
dds$sex <- relevel(dds$sex, ref="male")
dds$group <- relevel(dds$group, ref="control")

design(dds) <- ~ group*sex
dds <- DESeq(dds)
resultsNames(dds)

Which gives:

 [1] "Intercept" "group_1w_vs_control" "group_2w_vs_control" "group_4w_vs_control" "group_8w_vs_control" "sex_female_vs_male" "group1w.sexfemale"   "group2w.sexfemale"  
 [9] "group4w.sexfemale"   "group8w.sexfemale"

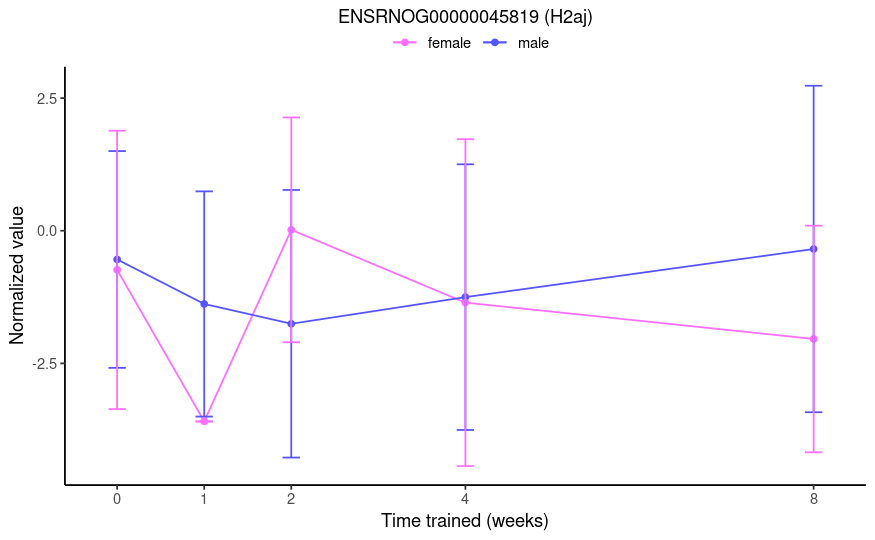
From this post, I thought group1w.sexfemale would test if the 1-week effect (i.e., 1w - control) is different between females and males. However, the results aren't consistent with that. See below the plot of a gene that had a log fold-change of -23.2 and an adjusted p-value of 1e-4 for this specific contrast name. From the TMM-normalized data, I would expect a marginally significant result of roughly 3-fold.

Significant result

I would appreciate any help!

DifferentialExpression contrasts interaction DESeq2 • 3.2k views
ADD COMMENT
2
Entering edit mode
Nicole ▴ 10
@cd7563ba
Last seen 15 months ago
United States

The comment from Michael Love about specifying numeric contrasts answered my question. This code is not standalone, but I will leave it here in case it is helpful to someone else.

# make contrast
contrast = paste0('~ 0 + ', paste0(c("sex_group", covariates), collapse=' + '))

# run DESeq
dds = DESeqDataSetFromMatrix(countData = counts,
                             colData = meta,
                             design = eval(parse(text=contrast)))
dds = DESeq(dds, quiet = T)
resultsNames(dds)

# if you want (D - C) - (B - A), then use a cell means design (no intercept) and then you will have coefficients A,B,C,D. Then you can specify contrast=c(1, -1, -1, 1).
# I want the following contrasts:
# (female_1w - female_control) - (male_1w - male_control) = sex_groupfemale_1w - sex_groupfemale_control - sex_groupmale_1w + sex_groupmale_control
# (female_2w - female_control) - (male_2w - male_control) = sex_groupfemale_2w - sex_groupfemale_control - sex_groupmale_2w + sex_groupmale_control
# (female_4w - female_control) - (male_4w - male_control) = sex_groupfemale_4w - sex_groupfemale_control - sex_groupmale_4w + sex_groupmale_control
# (female_8w - female_control) - (male_8w - male_control) = sex_groupfemale_8w - sex_groupfemale_control - sex_groupmale_8w + sex_groupmale_control

make_numeric_contrast = function(dds, positive, negative){
  resnames = resultsNames(dds)
  num_contrast = rep(0, length(resnames))
  names(num_contrast) = resnames
  num_contrast[names(num_contrast) %in% positive] = 1
  num_contrast[names(num_contrast) %in% negative] = -1
  return(num_contrast)
}

numeric_contrasts = list()
for(tp in c("1w","2w","4w","8w")){
  numeric_contrasts[[tp]] = make_numeric_contrast(dds, 
                                                  positive = c(sprintf("sex_groupfemale_%s", tp), "sex_groupmale_control"), 
                                                  negative = c("sex_groupfemale_control", sprintf("sex_groupmale_%s", tp)))
}

# get results for each contrast 
res_list = list()
for(tp in c("1w","2w","4w","8w")){
  res = results(dds, contrast = numeric_contrasts[[tp]])
  res_dt = data.table(gene_id = rownames(counts), 
                      log2FoldChange = res$log2FoldChange,
                      lfcSE = res$lfcSE,
                      pvalue = res$pvalue,
                      zscore = res$stat, 
                      contrast = sprintf("(female_%s vs female_control) vs (male_%s vs male_control)", tp, tp))
  res_list[[tp]] = res_dt
}
all_res = rbindlist(res_list)
ADD COMMENT
0
Entering edit mode
swbarnes2 ★ 1.3k
@swbarnes2-14086
Last seen 15 hours ago
San Diego

That post has a very different design than you do. The design of making a new column in colData by concatenating the different elements together into one is a pretty straightforward and readable way to accomplish a simple subgroup to subgroup comparison, like you would want to compare wk1F to wk1M.

What you have picked from resultsNames is not that comparison. It is looking to see what genes change differently between males and females in the control week versus week1. It is the "differences of differences" comparison.

ADD COMMENT
0
Entering edit mode

No, you misunderstood my question. This is not a simple comparison of two groups. I do not want to compare 1w F to 1w M. Rather, I want to compare the training effects at 1 week between the sexes, i.e. (male:1w - male:control) - (female:1w - female:control).

It is looking to see what genes change differently between males and females in the control week versus week1. It is the "differences of differences" comparison.

Right, that's exactly the comparison I want. But the results are not interpretable as such. If you look at the 0-week (control) and 1-week time points in the plot I provided, you will see that a logFC of -23.2 is not a reasonable result. Therefore, I do not believe that the group1w.sexfemale contrast is giving me the difference of differences that I want. Though perhaps the values for this gene are 0-inflated, giving me a much different logFC than I would expect with the TMM-normalized data.

ADD REPLY
1
Entering edit mode

If you know how to formulate the result in limma, use a numeric-style contrast when calling results().

E.g. if you want (D - C) - (B - A), then use a cell means design (no intercept) and then you will have coefficients A,B,C,D. Then you can specify contrast=c(1, -1, -1, 1).

ADD REPLY
0
Entering edit mode

Thank you, Michael Love - that did it! The results make sense now. From my original post, could you clarify what the group1w.sexfemale contrast would test? From reading the docs, I thought group1w.sexfemale would be equivalent to (group_female_1w - group_female_control) - (group_male_1w - group_male_control), but they give very different results.

ADD REPLY
0
Entering edit mode

They give a correlation of 1 for me, maybe look over the code.

library(DESeq2)
dds <- makeExampleDESeqDataSet(n=50, m=100)
dds$sex <- factor(rep(c("male","female"), each=25))
dds$group <- factor(rep(c("control","1w","2w","4w","8w"), 10))
dds$sex <- relevel(dds$sex, ref="male")
dds$group <- relevel(dds$group, ref="control")
design(dds) <- ~group*sex
dds <- DESeq(dds)
res1 <- results(dds, name="group1w.sexfemale")
dds$x <- factor(paste0(dds$group, "_", dds$sex))
design(dds) <- ~0 + x
dds <- DESeq(dds)
res2 <- results(dds, contrast=c(1,-1,0,0,0,0,0,0,-1,1))
cor(res1$log2FoldChange, res2$log2FoldChange)
ADD REPLY
0
Entering edit mode

Thank you! I'll look into it on my end.

ADD REPLY

Login before adding your answer.

Traffic: 721 users visited in the last hour
Help About
FAQ
Access RSS
API
Stats

Use of this site constitutes acceptance of our User Agreement and Privacy Policy.

Powered by the version 2.3.6