Entering edit mode

Enter the body of text here
Dear All,
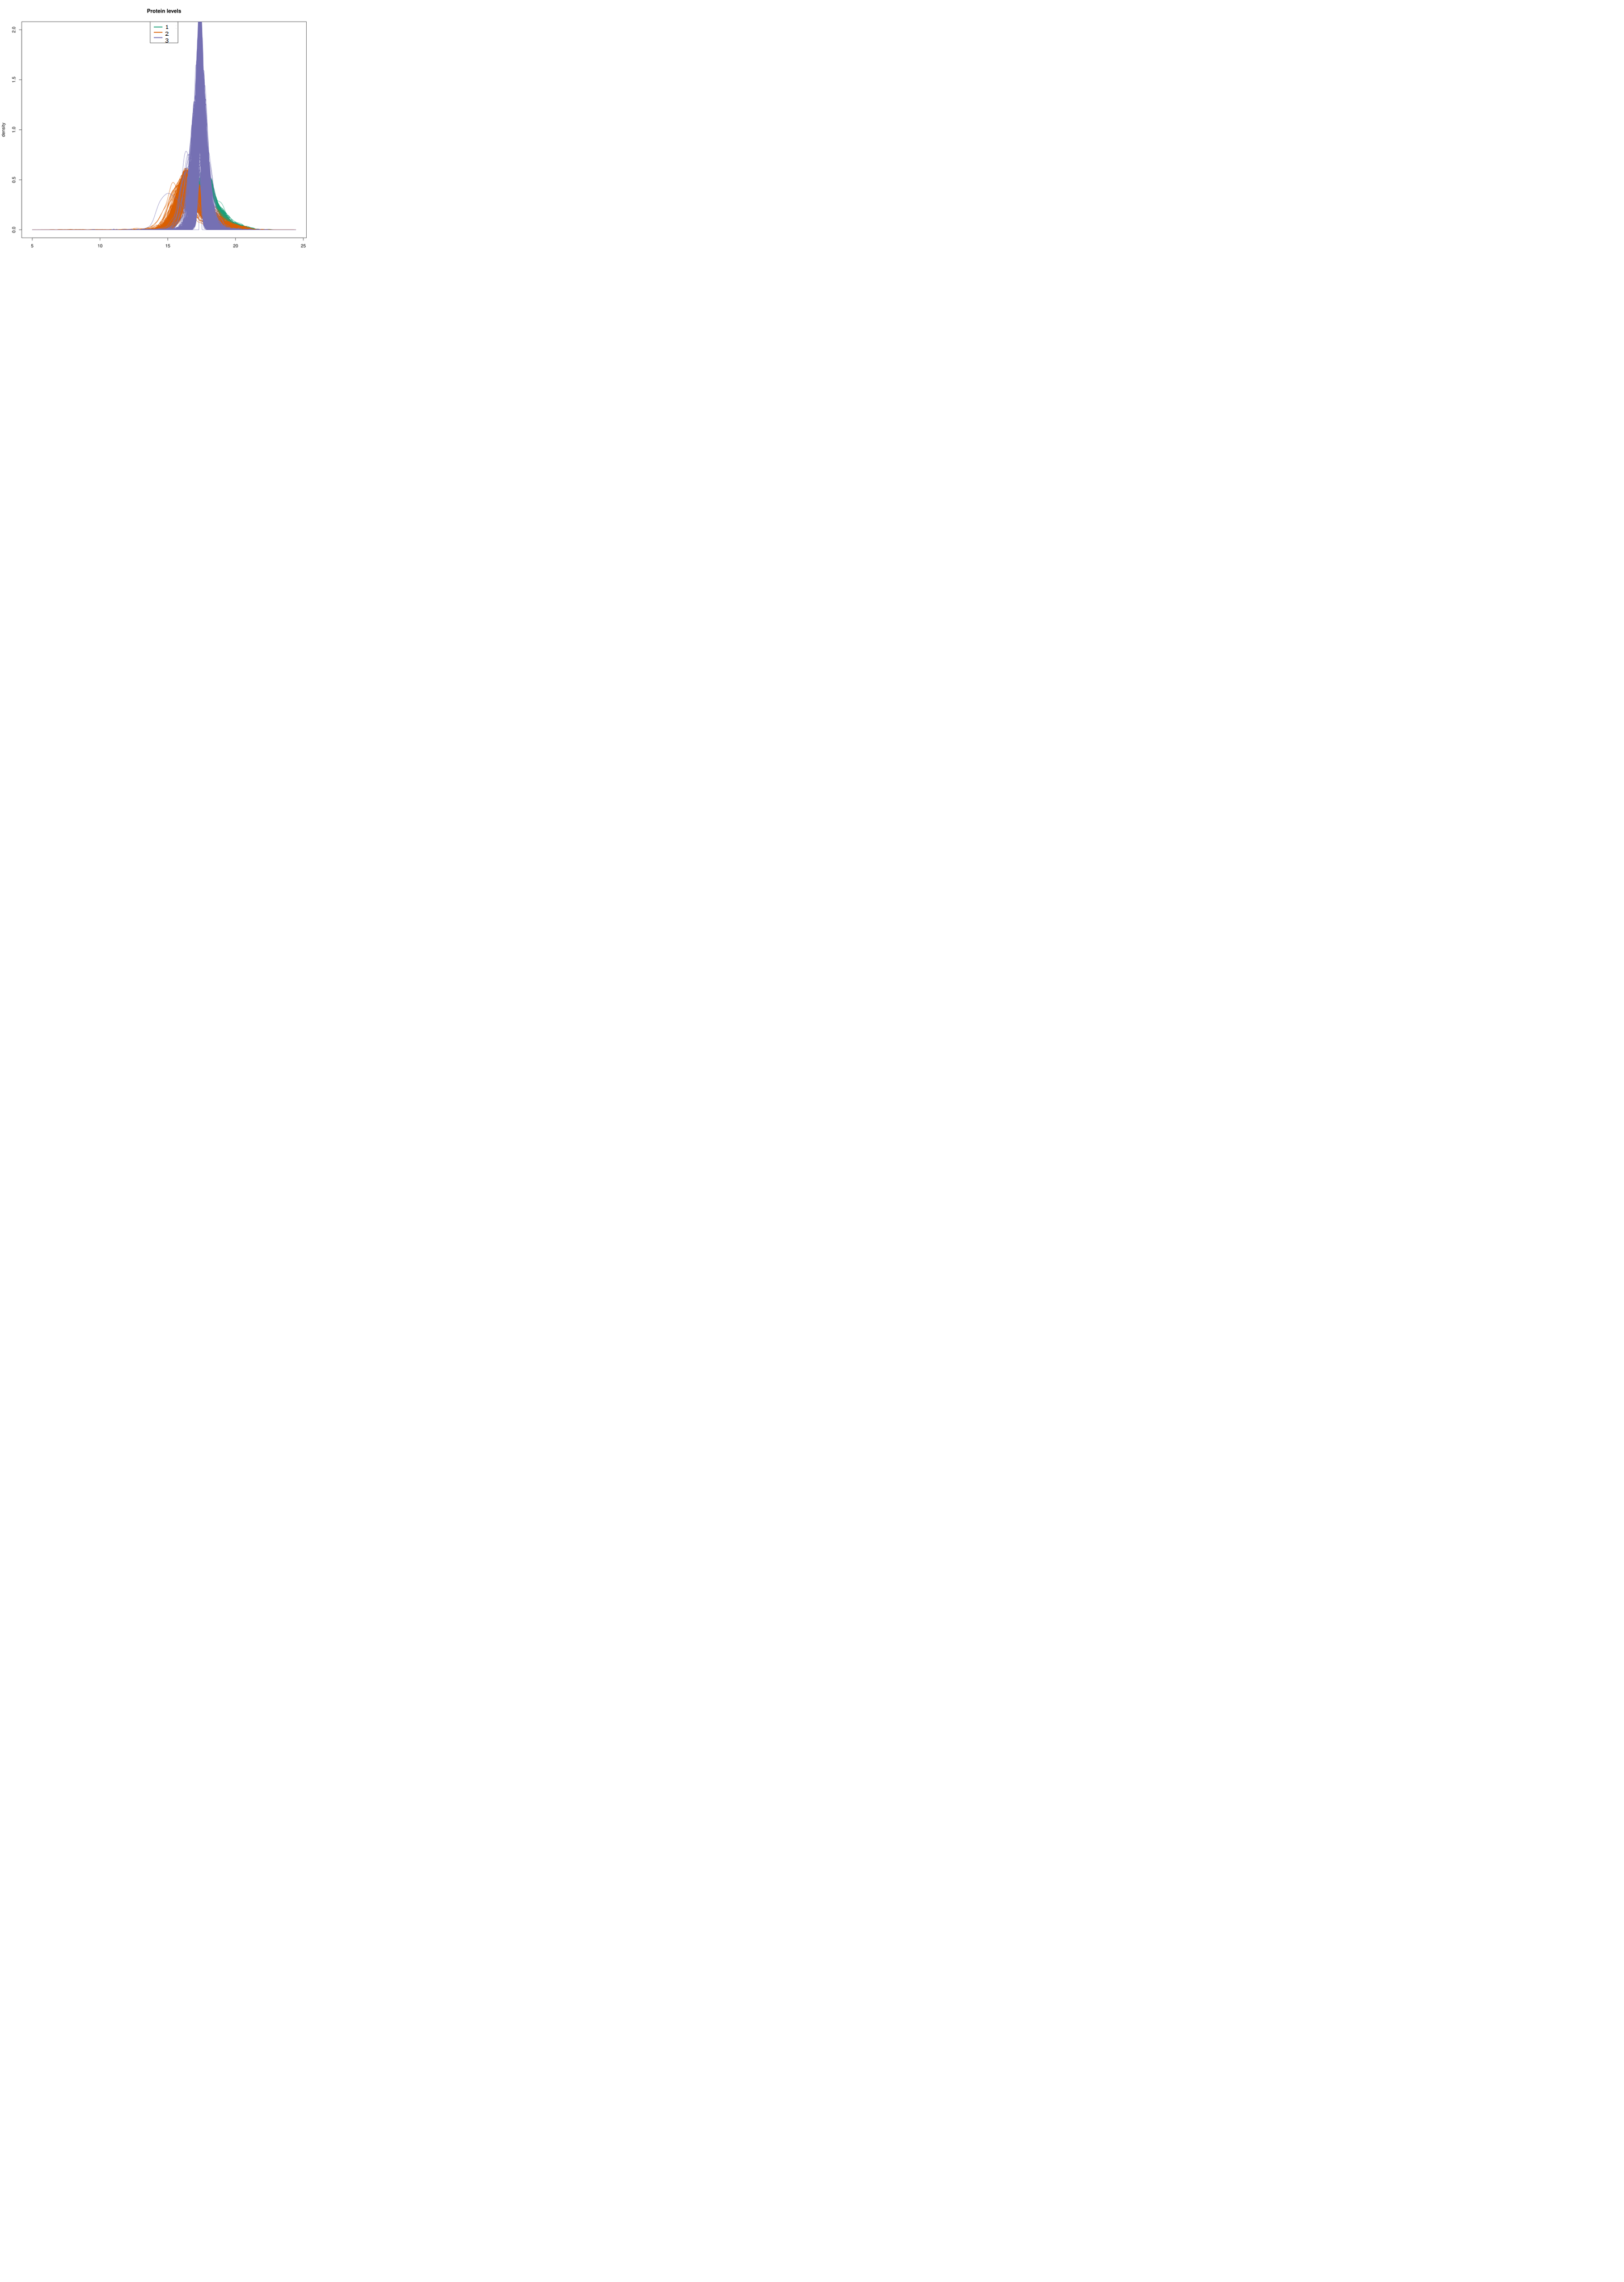
I am new to the list and wonder if there is any suggestion on handling datasets I came across. The data came in three batches with ~1,000 biomarkers -- apparently there is batch effect as shown in the plots. We hope to keep all data points and ideally could have a satisfactory approach for analysis. So far we have fixed our minds on meta-analyzing summary statistics on SNP-biomarker association (our main interest), the usual procedure is to employ inverse normal transformation with adjustment for covariates and principle components. Any comments on this?

which were obtained with
library(quantro)
quantro(edata,batch,B=10000)
matboxplot(edata,batch)
matdensity(edata, batch, xlab = " ", ylab = "density", ylim=c(0,2), main = "Protein levels", brewer.n = 8, brewer.name = "Dark2")
legend('top', c("1", "2", "3"), col = c(1, 2, 3), lty = 1, lwd = 3)
Thank you very much in advance,
Jing Hua