How to add gene symbol in GeneRegionTrack in Gviz
1
0
Entering edit mode
hsf378 • 0
@f4408afb
Last seen 20 months ago
Denmark

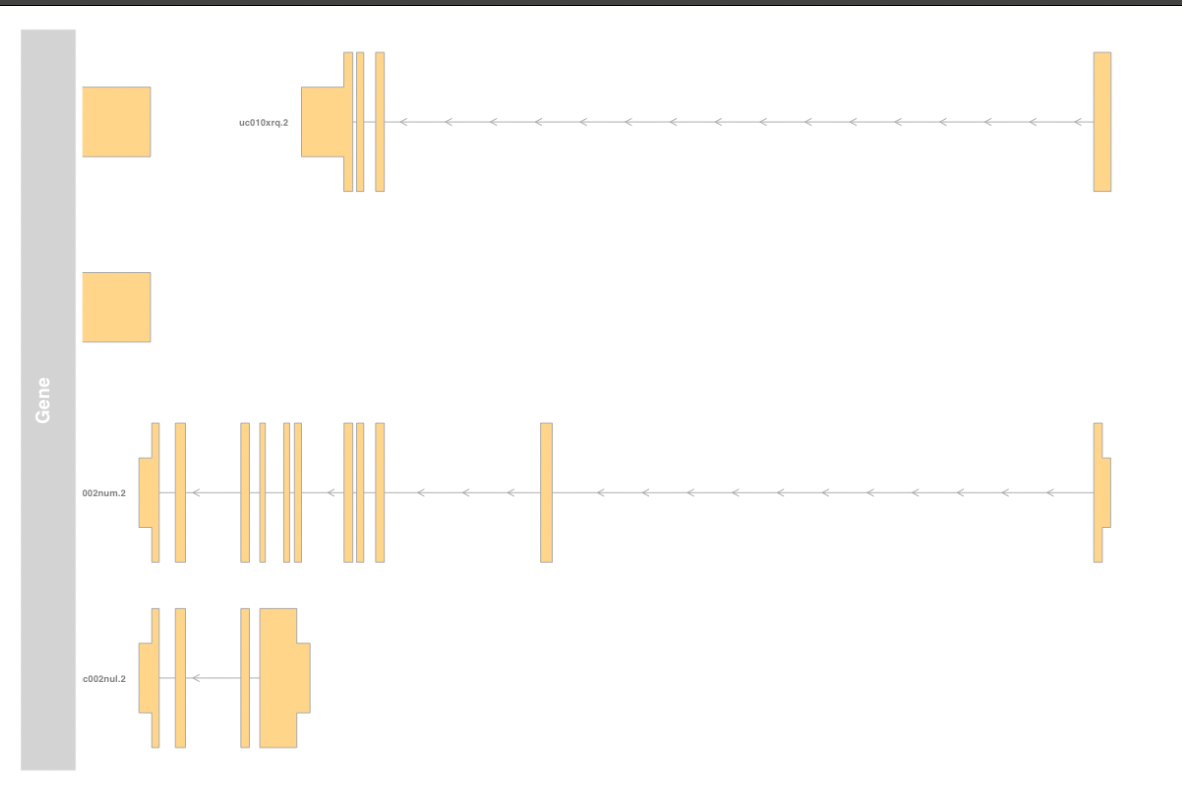
Hello. I am trying to create a GeneRegionTrack using Gviz. I would like to display the gene symbol rather than the Ensembl transcript ID in the gene track. Please see below:

gene <- GeneRegionTrack(TxDb.Hsapiens.UCSC.hg19.knownGene, 
                        name ='Gene', 
                        showId = TRUE, 
                        transcriptAnnotation = "symbol",
                        geneSymbol = TRUE)

plotTracks(gene,
           from = start,
           to = end,
           chromosome = 'chr19')

figure

The main issue here is that the TxDb object does not contain information about the gene symbol.

columns(TxDb.Hsapiens.UCSC.hg19.knownGene)

info of txdb

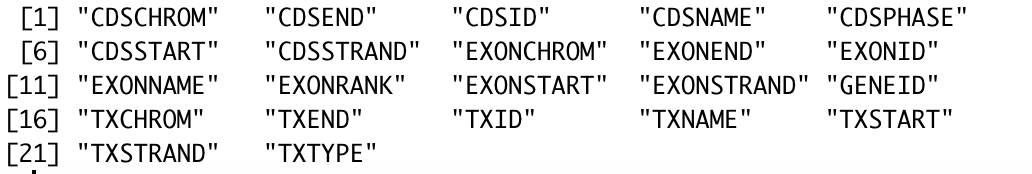
How to add the info of gene symbols in the TxDb object, then show the GeneRegionTrack with gene symbol instead of only the Ensembl transcript's ID?

Gviz • 1.3k views
ADD COMMENT
2
Entering edit mode
@james-w-macdonald-5106
Last seen 3 minutes ago
United States

I don't know of a 'stock' way to do this. But I do know the way I have been doing this for years now, which goes like this.

> library(TxDb.Hsapiens.UCSC.hg19.knownGene)
> library(Homo.sapiens)
> gene <- GeneRegionTrack(TxDb.Hsapiens.UCSC.hg19.knownGene, chromosome = "chr19", geneSymbol = TRUE, start = 33702400, end = 33716850, transcriptAnnotation = "symbol", name = "Gene")
> z <- ranges(gene)
> z$symbol <- mapIds(Homo.sapiens, z$symbol, "SYMBOL", "TXNAME")
'select()' returned 1:1 mapping between keys and columns
> ranges(gene) <- z
> plotTracks(gene)
ADD COMMENT

Login before adding your answer.

Traffic: 901 users visited in the last hour
Help About
FAQ
Access RSS
API
Stats

Use of this site constitutes acceptance of our User Agreement and Privacy Policy.

Powered by the version 2.3.6