What is the significance of "Zero Cross" in Ranked List Metric in Gene Set Enrichment Analysis ?
1
0
Entering edit mode
Bhavana • 0
@1d778e30
Last seen 21 months ago
Australia

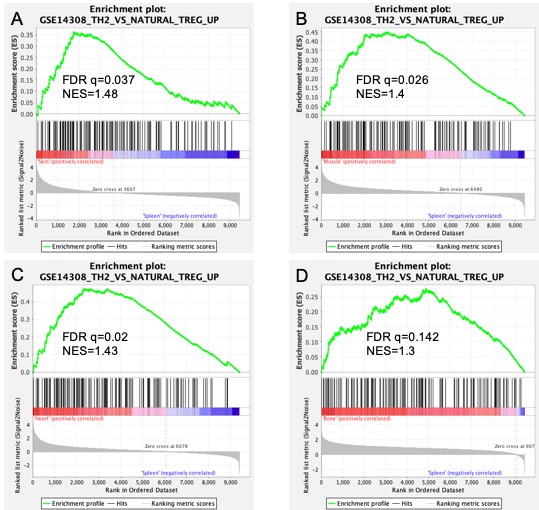
Hi, I am just starting to learn about GSEA analysis and I have conducted some analysis with four datasets so far. I have given below the gene set enrichment results of 4 datasets for the gene set (TH2 vs Natural Treg). Looking at the top half of the plots, my interpretation is that they are all enriched significantly. I have added in the FDR q vales and Normalised Enrichment Scores (NES) for each of them. However, I am a bit confused with the result in the bottom half of the plot. I am trying to understand what exactly does the "zero cross" mean? I have 4 I have read the user guide here (https://www.gsea-msigdb.org/gsea/doc/GSEAUserGuideFrame.html) and don't really find an answer to clarify this up for me. I specifically want to understand what is the significance or meaning of the differences in all these plots with respect to this "zero cross" value. Does it change any interpretation?, And what can one infer from it? For example, why is the zero cross for plot D at 907, and that of plot C at 6078 - what does this actually mean? Any guidance or help would be really appreciated, thank you!

GSEA plots

GSEA GeneSetEnrichment • 3.2k views
ADD COMMENT
0
Entering edit mode
Guido Hooiveld ★ 3.9k
@guido-hooiveld-2020
Last seen 12 hours ago
Wageningen University, Wageningen, the …

Please note that this forum is for Bioconductor packages-related questions, and GSEA is not a Bioconductor package. The Biostars forum may be a more appropriate place to ask your question.

Having said this, the 'zero cross value' is the position in the ranked list at which the ranking metric, thus the test statistic (e.g. log2FC, signed log(pvalues), t-test, or ... ) becomes zero (and then negative).

If the zero cross value is located extremely to the top (or bottom) of your ranked list [in the graph located very close to the left (resp. right)], it indicates that your ranked values are mostly positive (or negative). This could indicate an issue with the ranked list that was used as input. I mean, if you analyze a transcriptomics experiment you don't expect almost all genes 'measured' in your experiment to have (for example) a positive log2FC... This may happen if you analyze a subset of the transcriptome, but GSEA is then not a suitable approach but rather an overrepresenation analysis (ORA) should be used.

Since I usually rank on t-test- or z-scores, in my experiments the zero cross values are usually somewhat in the middle of the ranked lists.

ADD COMMENT
0
Entering edit mode

Thank you so much for your response, I will keep in mind regarding making posts about Bioconductor packages! :)

ADD REPLY

Login before adding your answer.

Traffic: 604 users visited in the last hour
Help About
FAQ
Access RSS
API
Stats

Use of this site constitutes acceptance of our User Agreement and Privacy Policy.

Powered by the version 2.3.6