ComplexHeatmap: Change font size of annotation axis values
1
0
Entering edit mode
nalaspina ▴ 10
@2cbc7d36
Last seen 21 months ago
United States

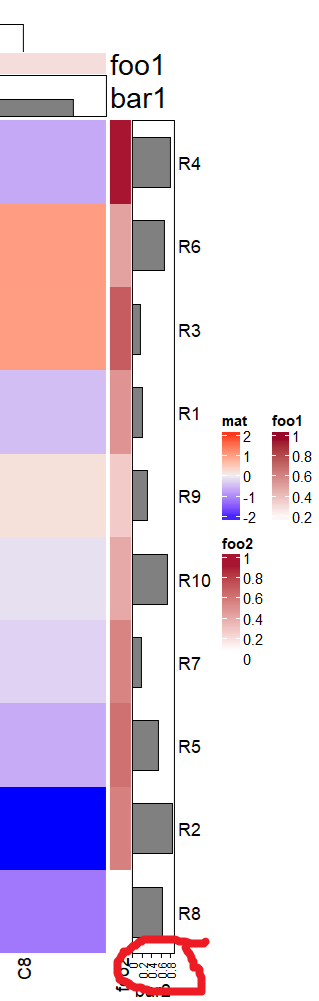
Is there a way to change the font size of the annotation axis values? These values often overlap, is the sizing automatic (circled in red below)?

Example (not my code): code source

set.seed(123)
mat = matrix(rnorm(100), 10)
rownames(mat) = paste0("R", 1:10)
colnames(mat) = paste0("C", 1:10)
column_ha = HeatmapAnnotation(foo1 = runif(10), bar1 = anno_barplot(runif(10)),
                              annotation_name_gp= gpar(fontsize = 20))
row_ha = rowAnnotation(foo2 = runif(10), bar2 = anno_barplot(runif(10)))
Heatmap(mat, name = "mat", top_annotation = column_ha, right_annotation = row_ha)

enter image description here

ComplexHeatmap • 2.1k views
ADD COMMENT
2
Entering edit mode
nalaspina ▴ 10
@2cbc7d36
Last seen 21 months ago
United States

Someone on the original post was kind enough to provide the answer (in bold below):

row_ha = rowAnnotation(foo2 = runif(10), bar2 = anno_barplot(runif(10), axis_param=list(gp=gpar(fontsize = 14))), width = unit(3, "cm"))

ADD COMMENT
0
Entering edit mode

this works!! thanks you saved me...

advice: be careful with the parentheses, there is the key

ADD REPLY

Login before adding your answer.

Traffic: 725 users visited in the last hour
Help About
FAQ
Access RSS
API
Stats

Use of this site constitutes acceptance of our User Agreement and Privacy Policy.

Powered by the version 2.3.6