Entering edit mode

Hi! I got a few questions about shrinking log2foldchanges using lfcShrink apeglm vs normal. I'm pretty inexperienced in the statistics side of this so any further reading is appreciated too.
I'm trying to create volcano plots (using EnhancedVolcano) to compare differentially expressed genes between two groups. My code is below.
txi <- tximport(files, type = "kallisto", tx2gene = t2g, ignoreTxVersion=TRUE)
dds <- DESeqDataSetFromTximport(txi, samples, ~ type)
dds <- DESeq(dds)
res <- lfcShrink(dds, coef="type_nonGEM_vs_GEM", type="apeglm")
res2<- lfcShrink(dds = dds,type = "normal",contrast=c("type","nonGEM","GEM"))
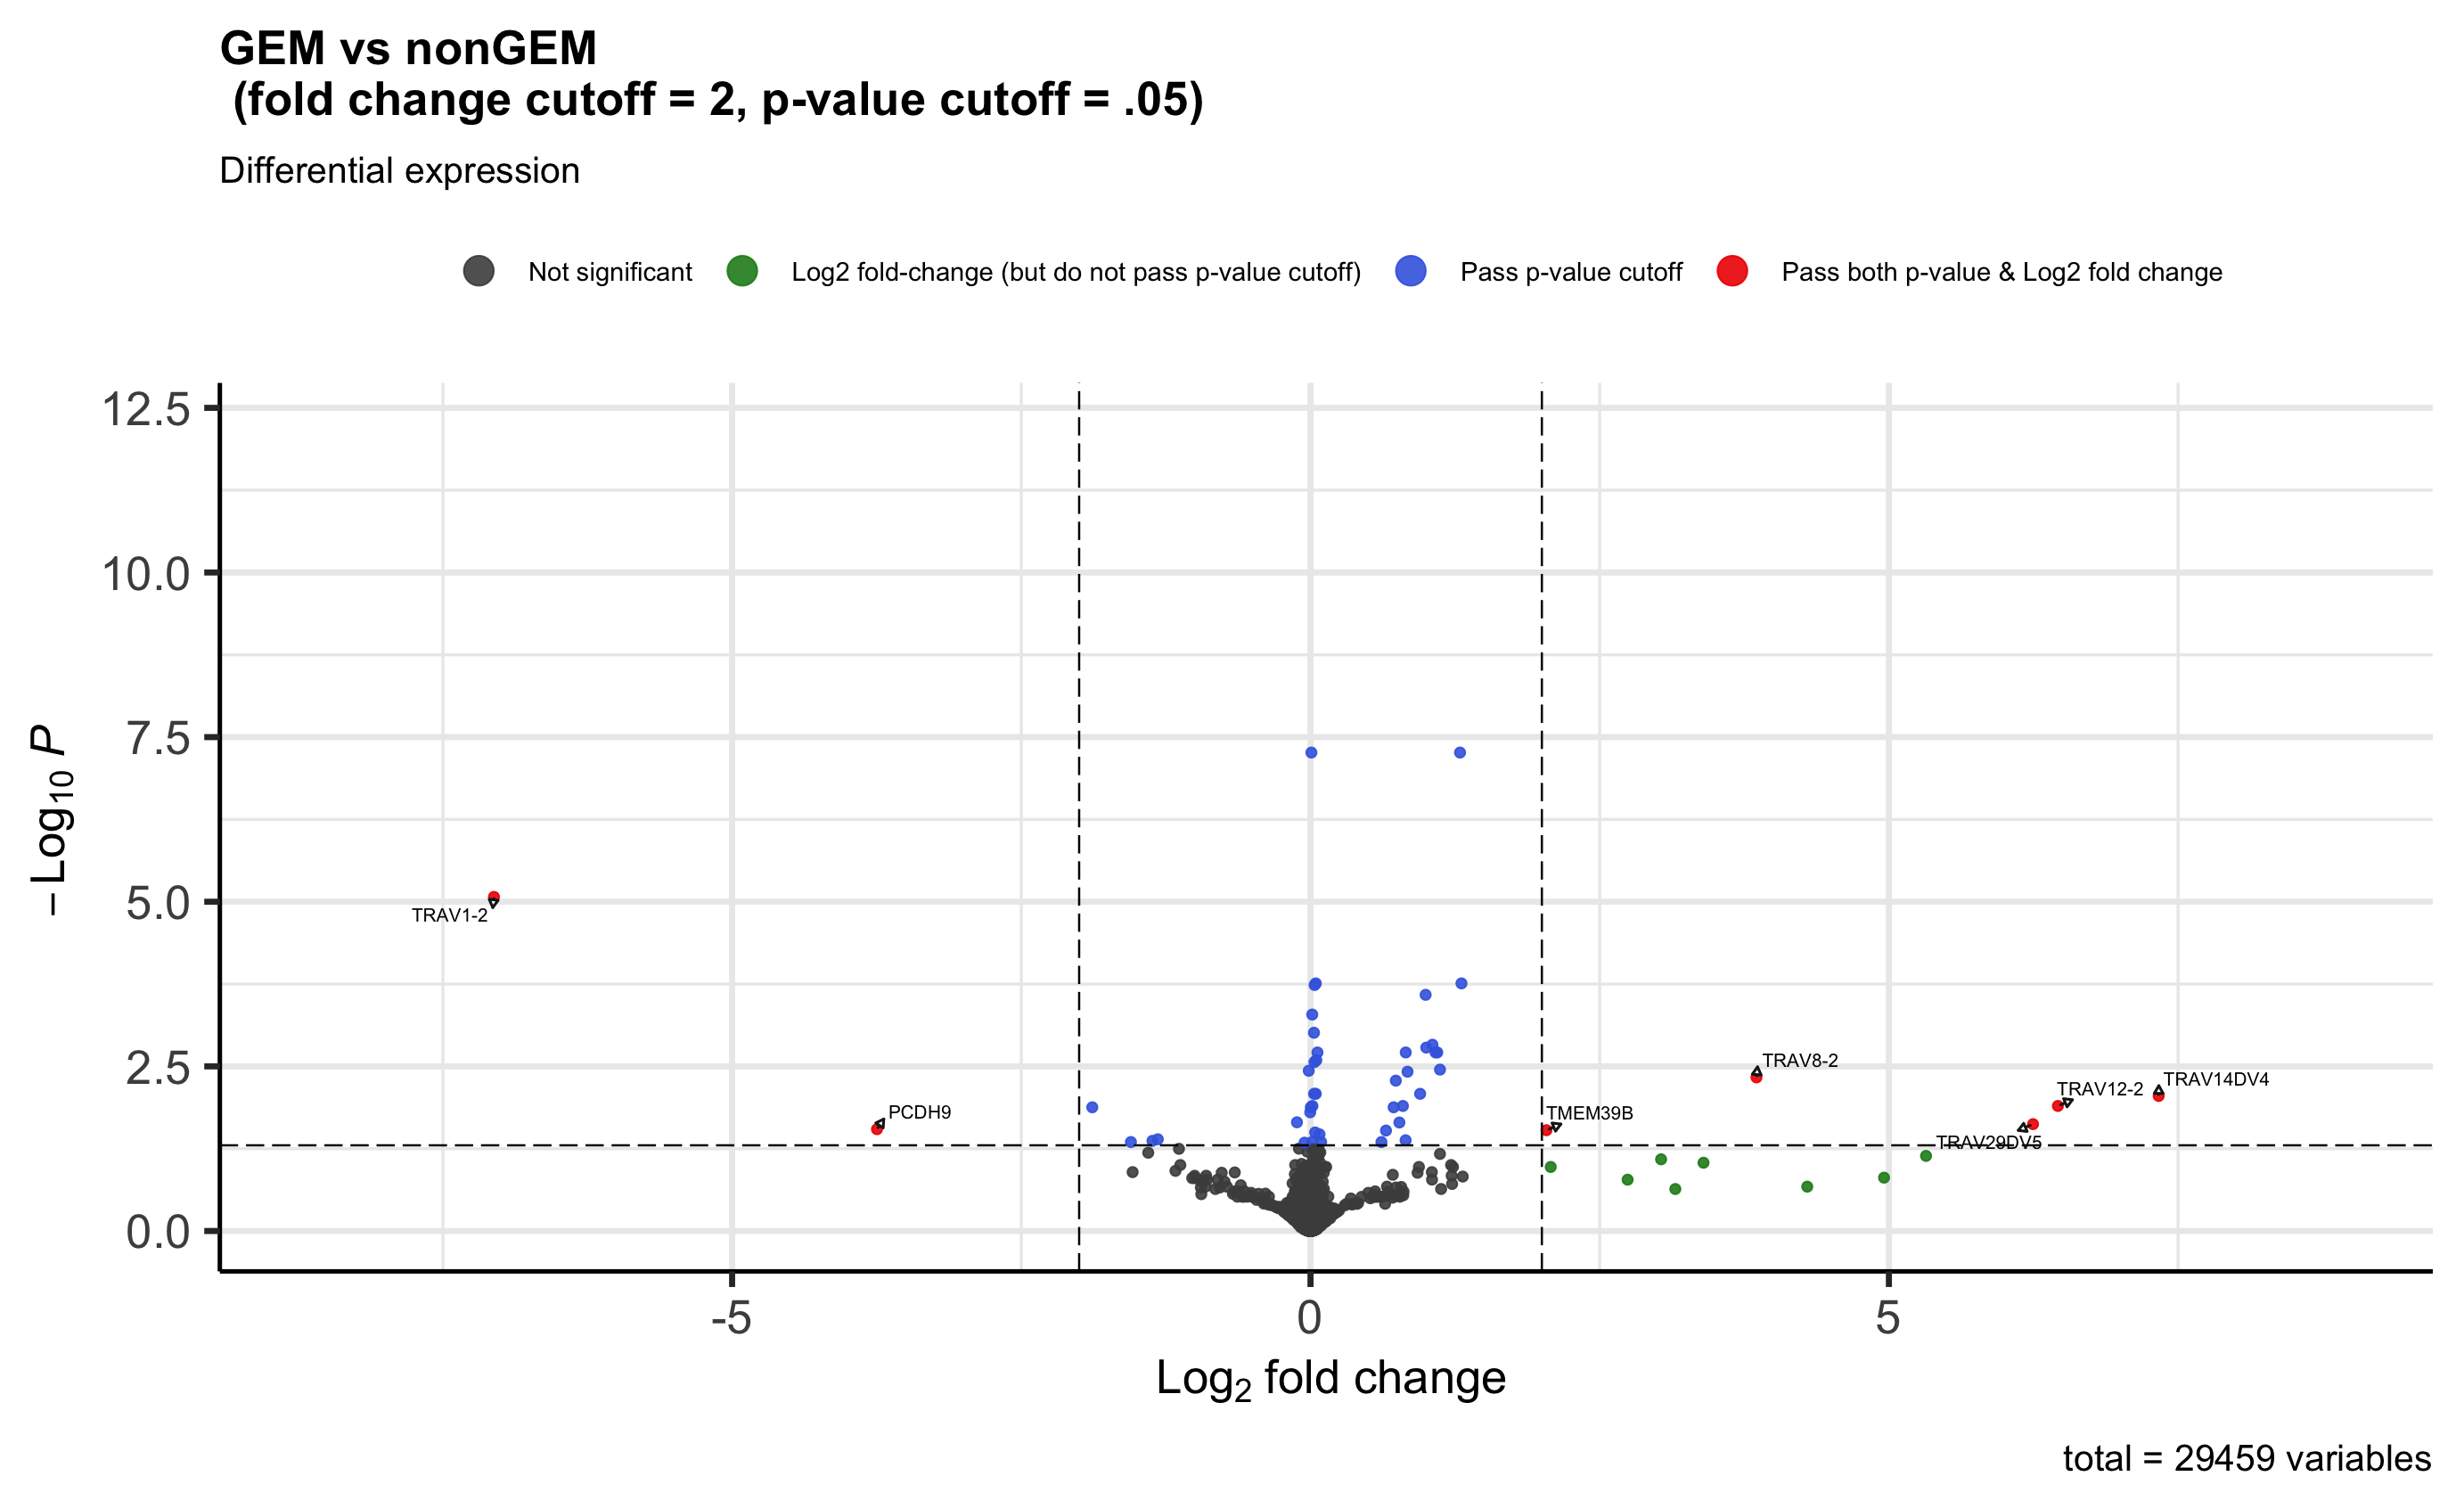
I know apeglm seems to be recommended over normal, but it doesn't look like volcano plots I've seen in the past, whereas "normal" creates a different looking plot. Is this a normal output or did I go wrong somewhere? How should I decide which type to use?
