
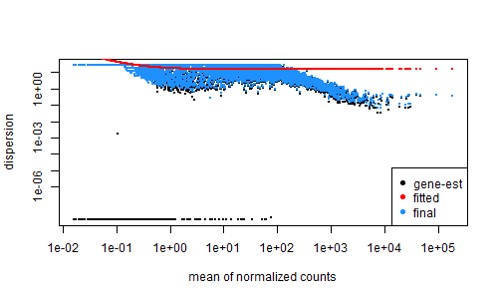
Essentially, due to low input RNA (issue with sequencer), there's a high number of 0s in the gene count matrix with featurecounts, and this gives a poor dispersion estimate (shown below, with ~60,000 genes)
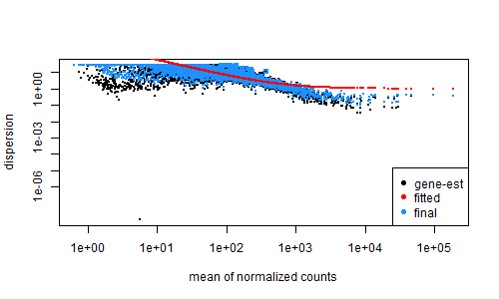
Then to deal with this, I filtered out the lowly expressed genes (with idx <- rowSums( counts(dds, normalized=TRUE) >= 5 ) >= 3)... which gives a slightly better fit (now use ~7000 genes)
Or alternatively, using HTSeq for assigning features and then also removing any genes where all counts were 0 (with ~14,000 genes) the dispersion estimate looks like this...
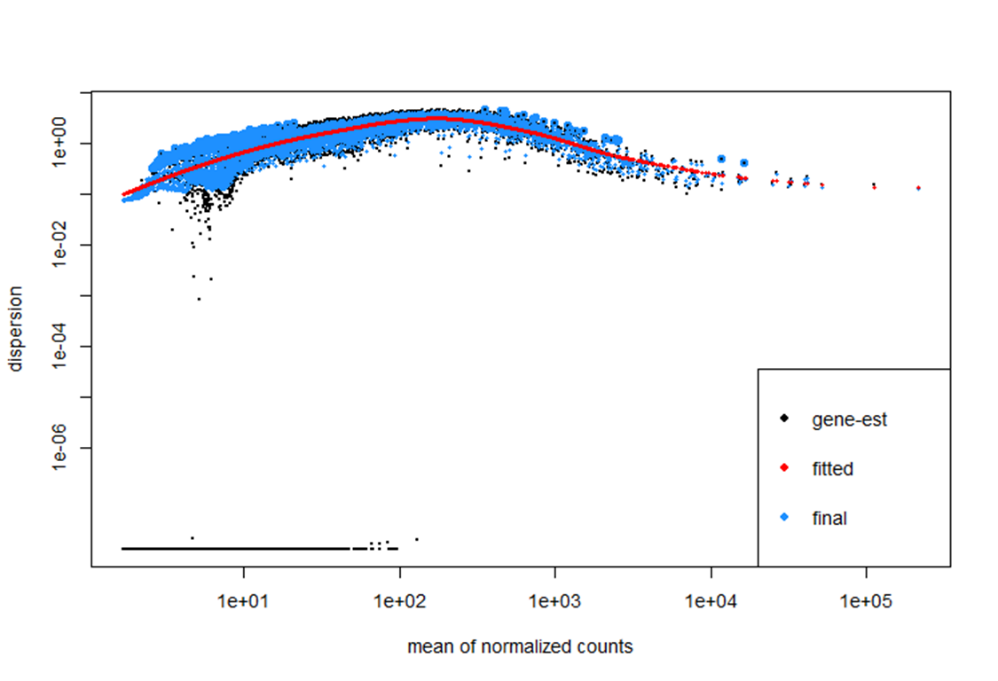
Which looks odd to me as it goes up and then down, but the fit looks very good? But essentially, I don't know whether filtering out the low genes, or use HTSeq rather than featurecounts is a better way of handling the data - I get differences in terms of PCAs (outliers etc) and differential gene expression (with some overlap)
Many thanks for any help or advice!
