how to make the "reconstructed" value in intergated scRNA-seq UMAP plot more readable
1
0
Entering edit mode
@shangguandong1996-21805
Last seen 18 months ago
China

Hi, I find the plotUMAP for reconstructed value after fastMNN is not readable. For example, here is my interesting gene in replicate 1 enter image description here

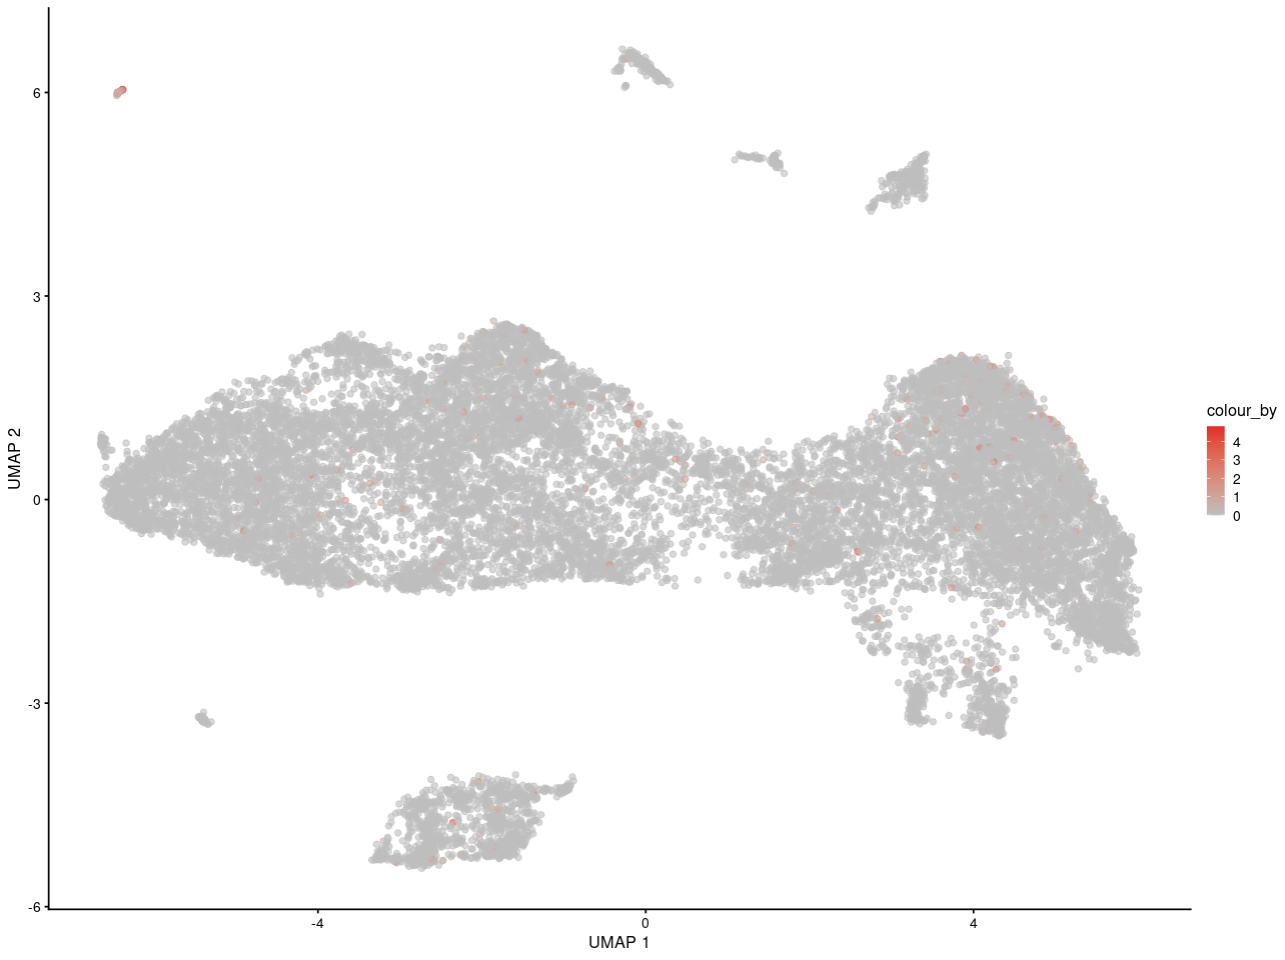
and here is in replicate 2 enter image description here

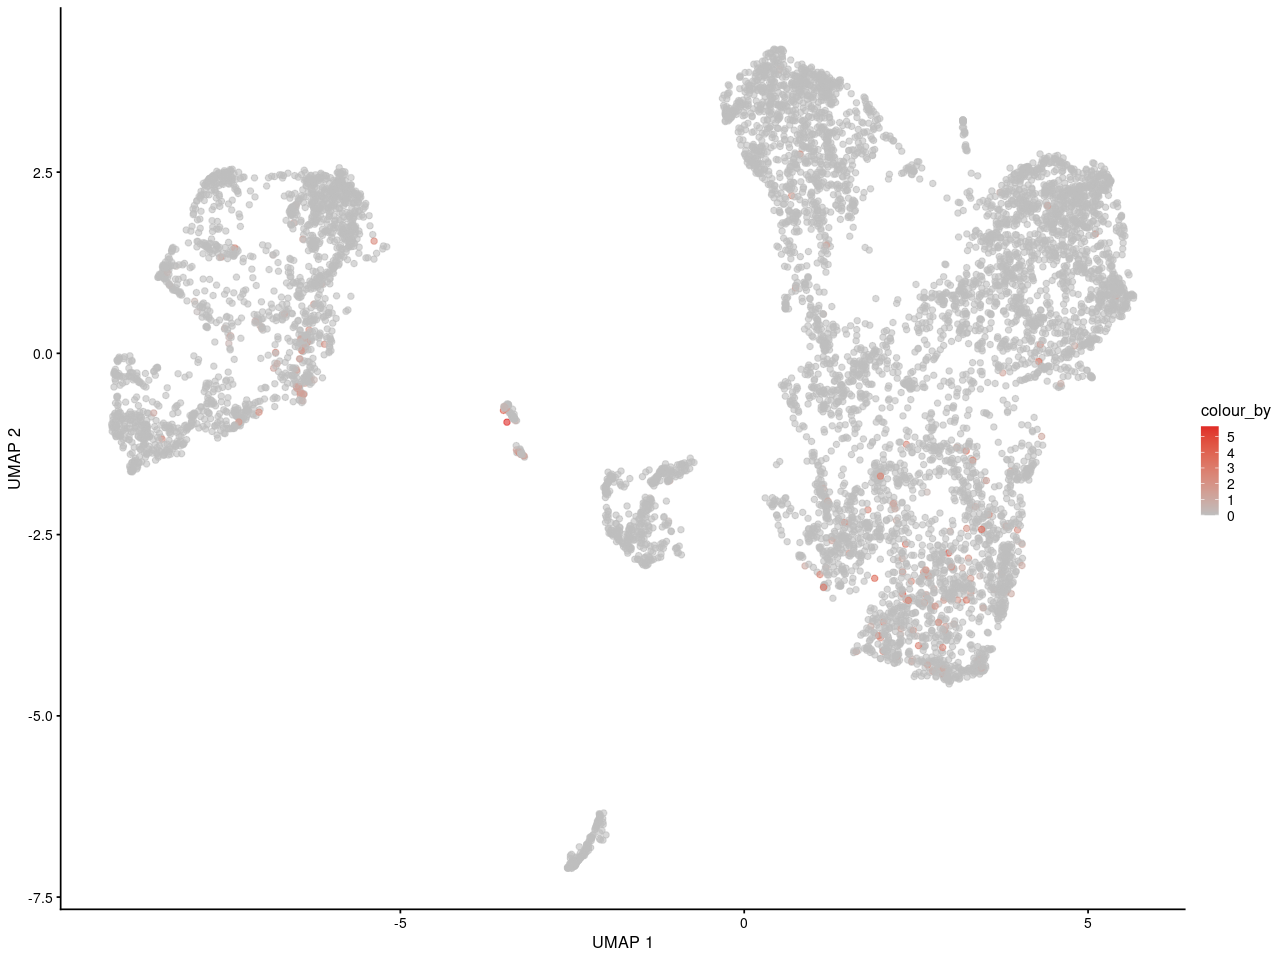
As you can see, I can see the gene may express in specific some cells. And for people who is not familar with scRNA-seq, they can get the same information as me. 
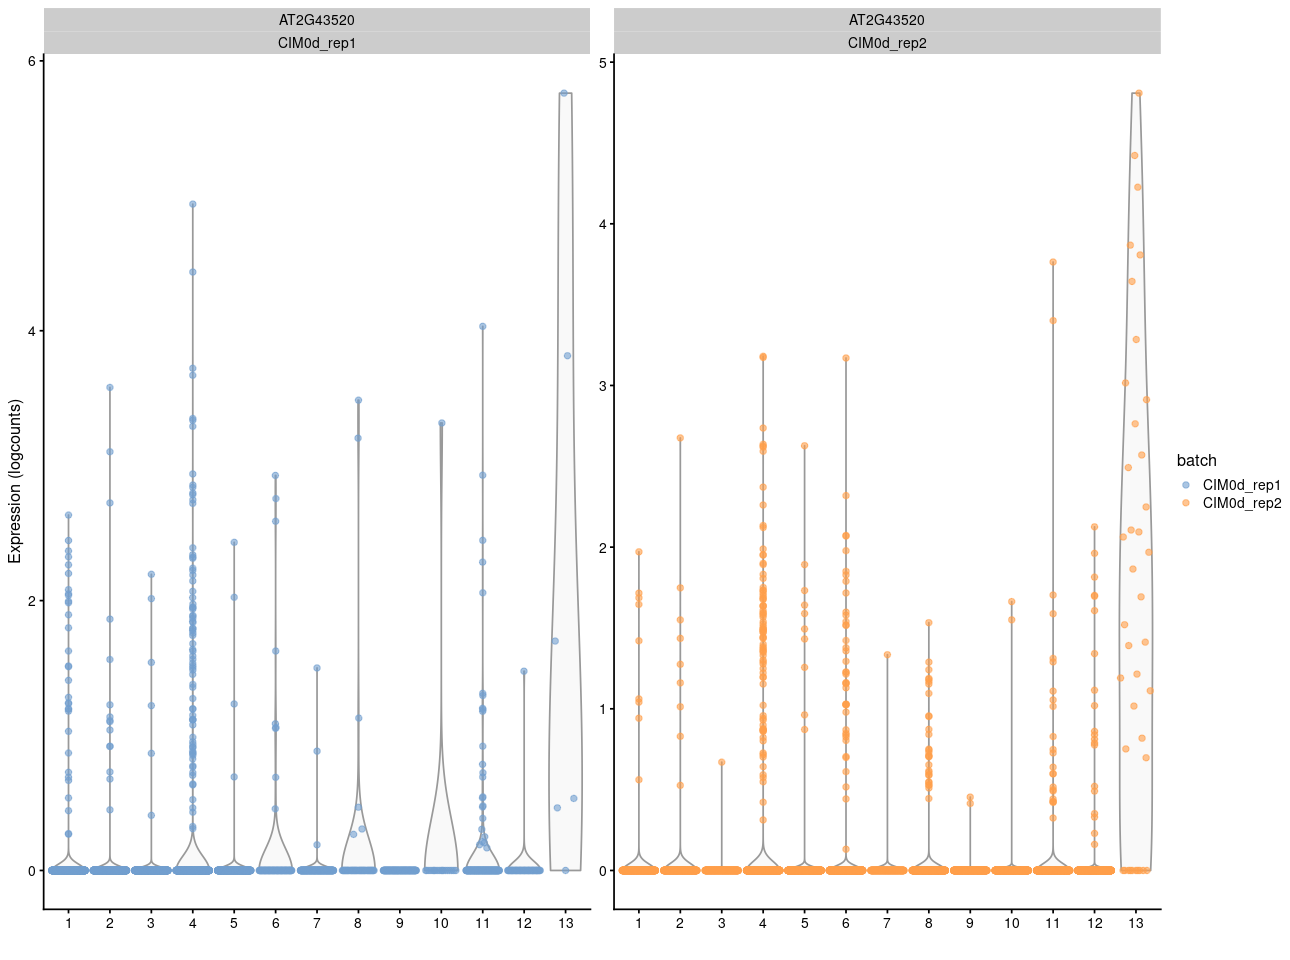
And here is the vilion plot enter image description here

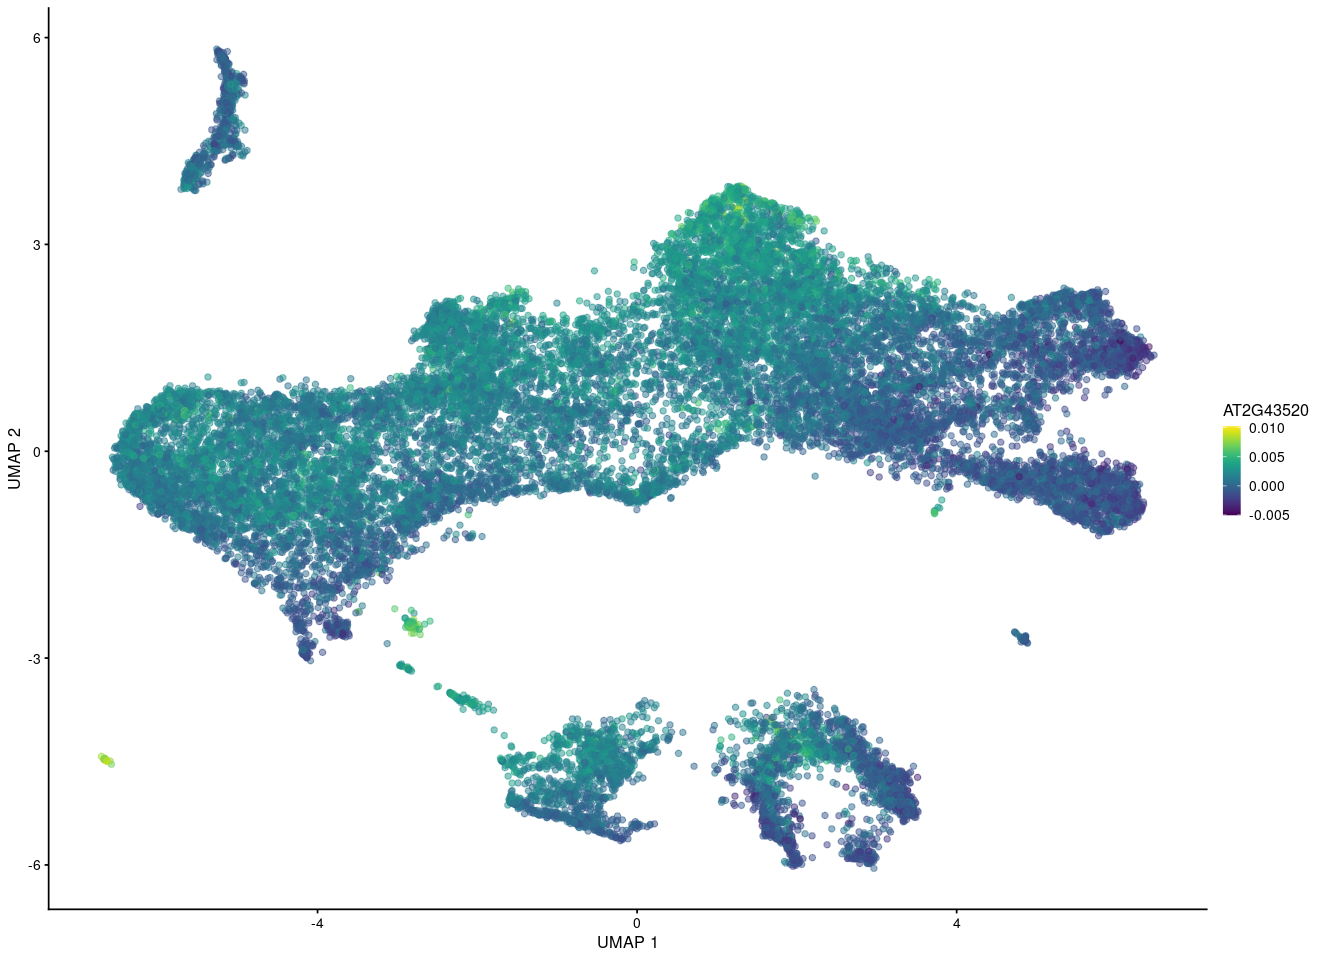
But if I want to show the gene in merged UMAP after fastMNN using the reconstructed value, it seems for other people that this gene is expressing eveywhere while some cells express high and some cells express low count.

enter image description here

So I am wondering whether some one can give me some advices about it.

Best wishes

Guandong Shang

scater batchelor scRNAseq fastMNN • 2.0k views
ADD COMMENT
0
Entering edit mode

What's the last plot from? The scale on the colour axis seems to have a very small range, which makes it seem like this may not actually represent large differences in expression between "high" and "low" groups. I imagine it would be possible to scale the values shown in your plot to make something similar, though I obviously would not advise you to do that.

However it's really hard to say what's "wrong" here without knowing further details.

ADD REPLY
0
Entering edit mode

Hi, thanks for your reply.

according to the OSCA manual about fastMNN

http://bioconductor.org/books/3.15/OSCA.multisample/integrating-datasets.html#mnn-correction

A reconstructed matrix in the assays() contains the corrected expression values for each gene in each cell, obtained by projecting the low-dimensional coordinates in corrected back into gene expression space. We do not recommend using this for anything other than visualization (Chapter 3).

I use this reconstructed value to show my gene expression on UMAP plot. And here is my summary about my gene

> summary(assay(mnn.out)["AT2G43520", ])
      Min.    1st Qu.     Median       Mean    3rd Qu.       Max. 
-0.0050264 -0.0002208  0.0009997  0.0009772  0.0021046  0.0102185
ADD REPLY
0
Entering edit mode

By the way, it seems that Seurat also have this problem for intergated scRNA-seq expression on UMAP according to this issue. They maybe use the min.cutoff parameter to drop these "non-expression" value?

ADD REPLY
0
Entering edit mode
Aaron Lun ★ 28k
@alun
Last seen 11 hours ago
The city by the bay

It is, in general, difficult to interpret the reconstructed assay, as batch correction is not guaranteed to do "sensible" things to the per-gene expression values - see commentary in Section 3.2 of the book.

I would just plot the original log-expression values, as these are safer to interpret. The only purpose of the reconstructed assay is to allow visualizations to avoid distracting "jumps" in color due to large batch effects, in cases where the distortions applied by the batch correction don't affect the conclusions and the batch effect is aesthetically displeasing. This is not the case in your scenario.

ADD COMMENT

Login before adding your answer.

Traffic: 826 users visited in the last hour
Help About
FAQ
Access RSS
API
Stats

Use of this site constitutes acceptance of our User Agreement and Privacy Policy.

Powered by the version 2.3.6