using DESeq2 for ATAC analyses
1
1
Entering edit mode
changxu.fan ▴ 20
@changxufan-24128
Last seen 12 months ago
United States

I love DESeq2!

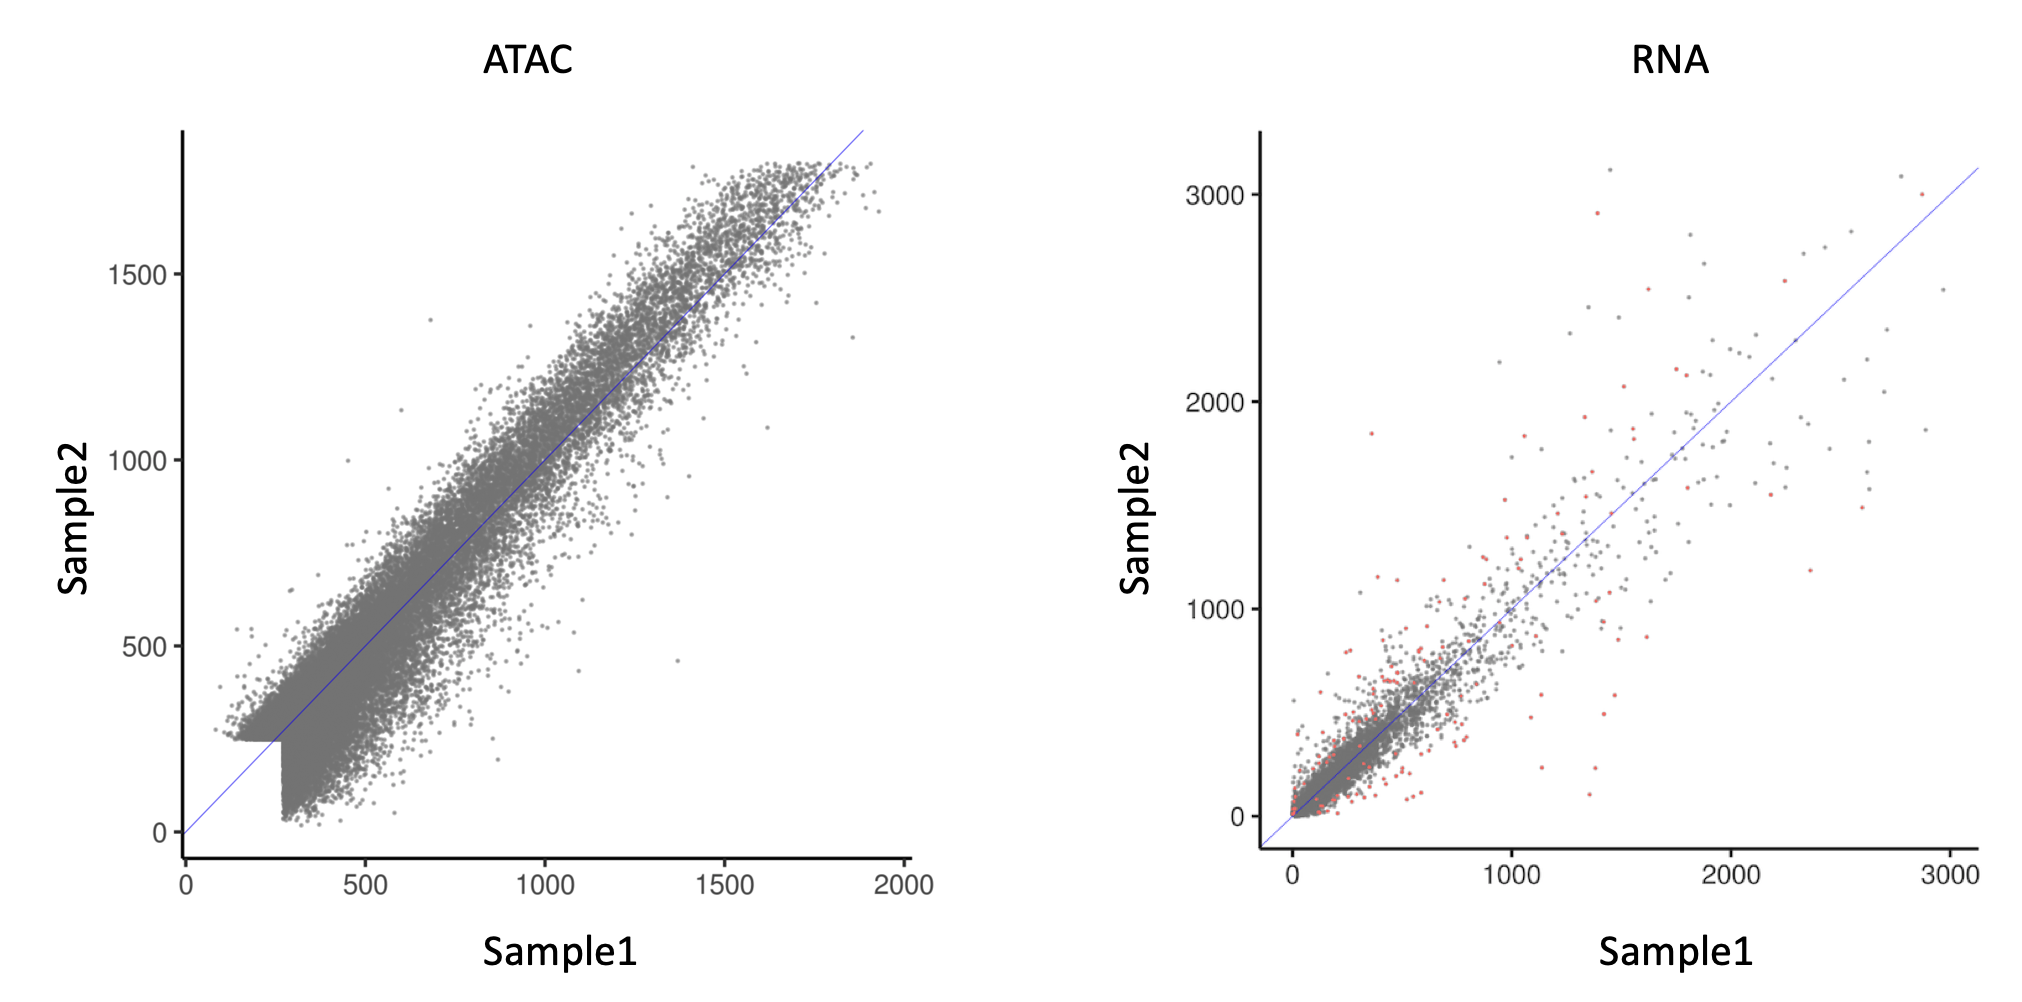
However, when using DESeq2 for ATAC analysis, I realized one potential issue. In the figure below:

Left is a scatter plot between 2 samples (biological replicates). Each point represents the read count at an ATAC peak. They are normalized by DESeq2 default normalization.

Right is a scatter plot of RNA expression between the same samples (I used multiome assay, so ATAC and RNA data are from exactly the same cells), also normalized by DESeq2 default normalization.

It's striking how these 2 assays differ. Compared to RNA, ATAC data has a striking lack of heteroskedasticity. In this case, would the statistical framework of DESeq2, which is based on a negative binomial assumption, still apply?

ATAC_vs_RNA_heteroskedasticity

Thanks!

ATACSeq DESeq2 • 4.4k views
ADD COMMENT
1
Entering edit mode

It does seem a little strange to do this, but DEseq2 does allow for a mean-dependent trend in the shared dispersion estimates, which should help compared to any tool that shrinks towards a single common dispersion estimate. Since it's not heteroskedastic, another sensible option might be limma.

ADD REPLY
0
Entering edit mode
@mikelove
Last seen 17 hours ago
United States

Here you are looking at counts across genes and peaks. In DESeq2 each gene/feature gets it's own dispersion. So for example, you could have all features Poisson, or some Poisson and some NB, etc. This means that you won't be able to assess heteroskedasticity (because you are not looking at counts from a single distribution) from a plot like this easily.

ADD COMMENT
0
Entering edit mode

Thanks for the reply! May I just follow up with a couple of questions?

All I'm trying to show with the plots is: in ATAC-seq, features with larger values do not show a larger variance. In fact, features with largest values are surprisingly consistent between biological replicates. Their variances are likely to be even smaller than what you would expect from a poisson distribution where mean equals variance. I was wondering if it's still appropriate to use DESeq2 for differential analyses for ATAC-seq, and if there are any recommended modifications to the standard workflow.

Per my understanding of the negative binomial distribution, the dispersion measures the additional variance added to a poisson distribution. However, if the variance is actually smaller than the mean, I'm not quite sure what to do...

Thanks again!

ADD REPLY
0
Entering edit mode

DESeq2 will figure out how variance depends on mean: this is because we do not use a global dispersion parameter, but we have a dispersion parameter for each gene.

ADD REPLY
0
Entering edit mode

To expand on what's written here: deseq2 can achieve roughly constant variance $C$ across genes by setting the per-gene dispersion $\phi_j$ equal to the solution of $C = \mu_j + \phi_j\mu_j^2$. This is a weird thing to do because:

  • It enforces $C>\mu$ if deseq2 enforces $\phi_j>0$. Michael Love would know for sure whether deseq2 enforces $\phi_j>0$.
  • within a gene, there are other factors affecting $\mu_j$, like covariates and size factors (really it's $\mu_ij$). Per-sample weights will vary strongly if $\phi_j$ is big, else weakly. This is different from a "vanilla" OLS-like complete lack of heteroskedasticity throughout. Arguably it's not what most people would knowingly default to here, though I agree you can't tell much from the data whether it's better or worse than "vanilla".
ADD REPLY

Login before adding your answer.

Traffic: 1112 users visited in the last hour
Help About
FAQ
Access RSS
API
Stats

Use of this site constitutes acceptance of our User Agreement and Privacy Policy.

Powered by the version 2.3.6