Entering edit mode

I have multiple datasets that I applied limma's differential expression analysis. To present the genes, I found that the MetaVolcanoR package is suitable.
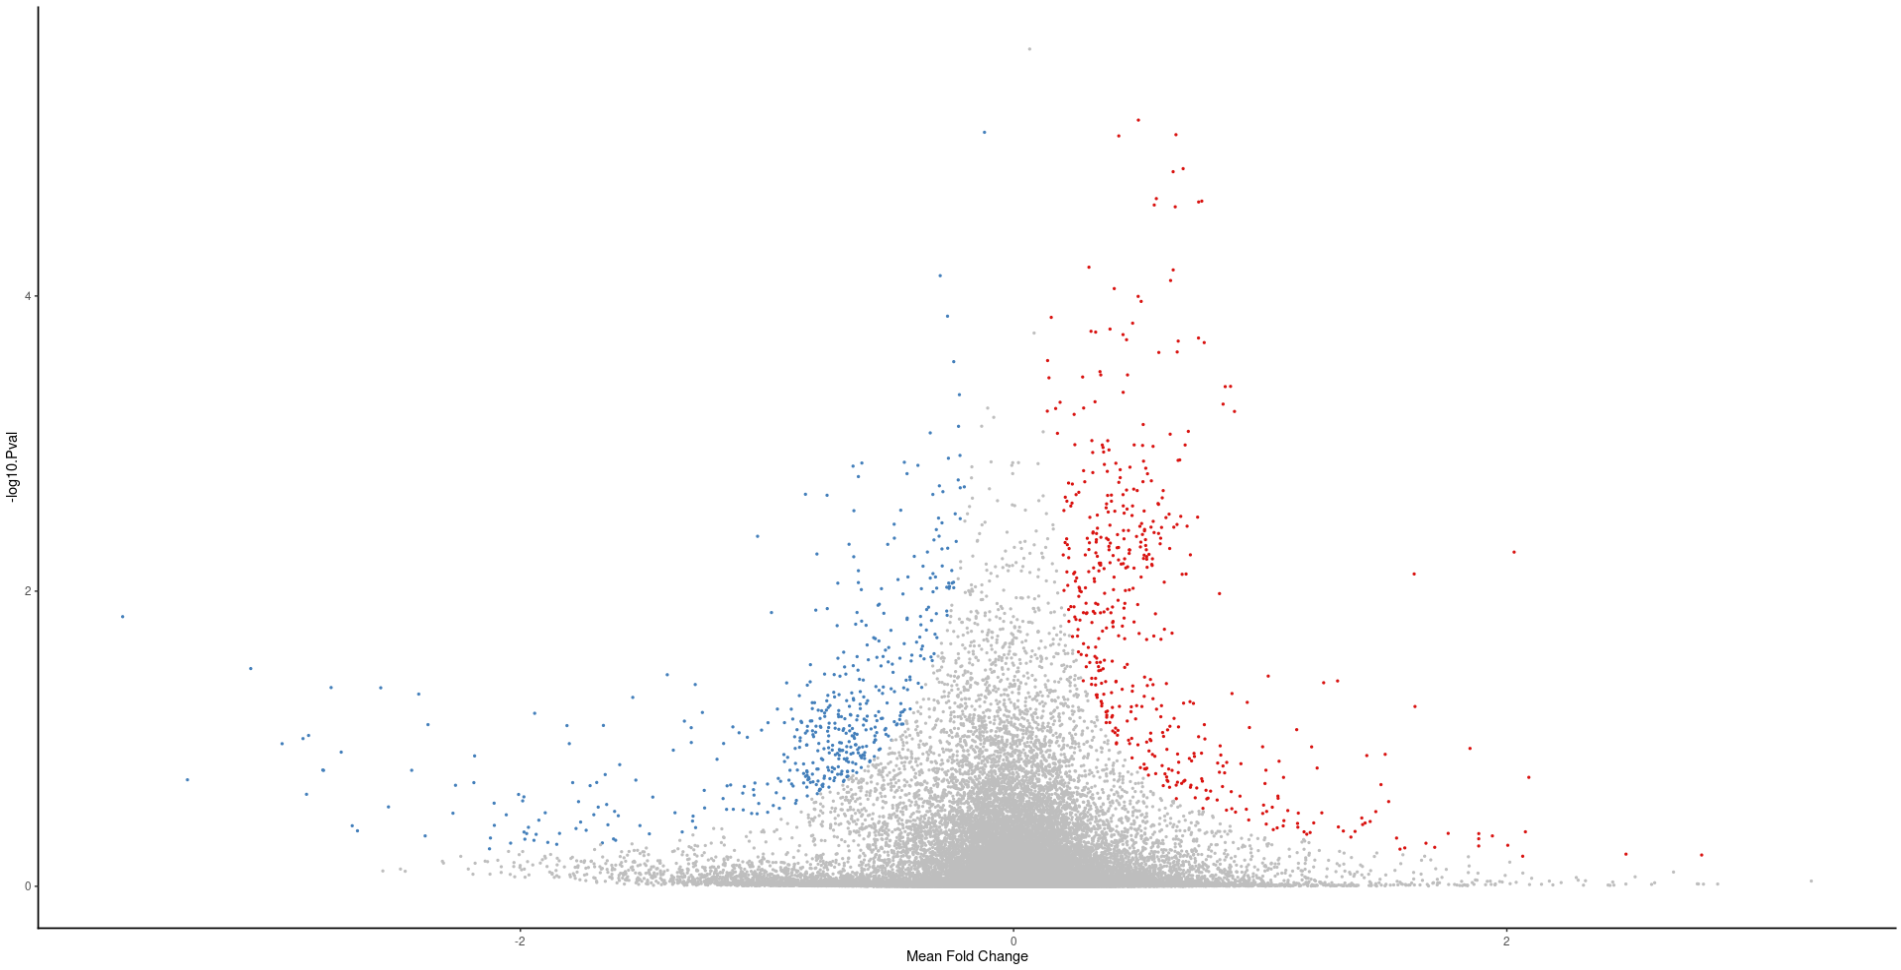
But, I don't understand how can I tune the parameters of the plot. How do I tell it what Mean Fold change (the x-axis) is significant? like how do I determine the threshold?
And the same for the P value ( y-axis), I see there is a threshold around 0.5 in this plot, how do I know for sure what threshold it's using?
This is my code: (the deg data frames are the results, containing all the genes for each data with the p-value and log fold change):
totalDEG = list(table4 = deg4, table6 = deg6,
                table7 = deg7,table8 = deg8 ,
                table15 = deg15, table21 = deg21)
totalDEG = map(totalDEG, ~ .x %>% rownames_to_column("symbol") %>% `row.names<-`(.$symbol))

meta_degs_comb <- combining_mv(diffexp=totalDEG,
                               pcriteria='adj.P.Val',
                               foldchangecol='LogFC',
                               genenamecol='symbol',
                               geneidcol=NULL,
                               metafc='Mean',
                               metathr=0.03,
                               collaps = TRUE,
                               jobname="MetaVolcano",
                               outputfolder=".",
                               draw='HTML')


plot(meta_degs_comb@MetaVolcano )+ ylab('-log10.Pval')
Removed
EnhancedVolcanotag.