
Hi everyone
I'm experiencing a problem with DESEq2. I downloaded matched tumour-normal cancer data from the TCGA (111 patients, 222 samples), and am attempting to perform differential expression. The ultimate aim of my project is to use machine learning to identify a select few genes that can distinguish between normal and cancerous tissue, for the purpose of biomarker discovery.
But as a preliminary, I wanted to use DESeq2 to visualise clustering between tumour and normal samples using all coding genes (i.e. ~30,000 genes).
My code:
# read files
countData <- read_tsv("chosen_TCGA_gene_count_matrix.tsv")
colData <- read_tsv("TCGA_chosen_colData.tsv")

#make sure factors are factors
colData$patient <- as.factor(colData$patient)
colData$sample_type <- as.factor(colData$sample_type)

countData.mat <- as.matrix(countData)

## make dds
dds.tcga<- DESeqDataSetFromMatrix(countData = countData.mat,
                                     colData = colData, design = ~ patient + sample_type)


# re-level so that base level is Normal tissue
dds.tcga$sample_type <- relevel(dds.tcga$sample_type, ref = "Solid Tissue Normal")

#filter out low count genes
keep <- rowSums((counts(dds.tcga)) >= 10) >=3
dds.tcga <- dds.tcga[keep,]


# run DESeq2
dds.tcga <- DESeq(dds.tcga)


# vst transform
vst <- vst(dds.tcga)

#plot
plotPCA(vst, intgroup=c("sample_type"), ntop = 200)
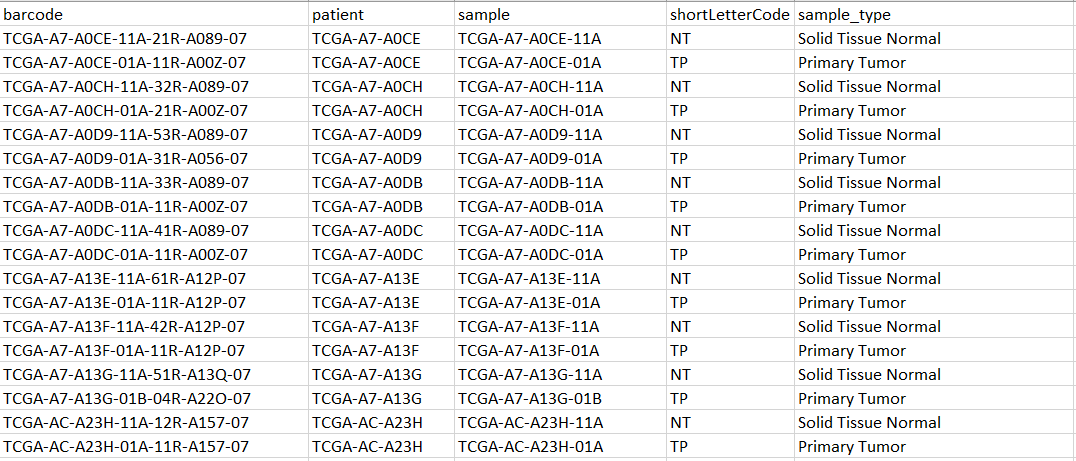
An example of my metadata:
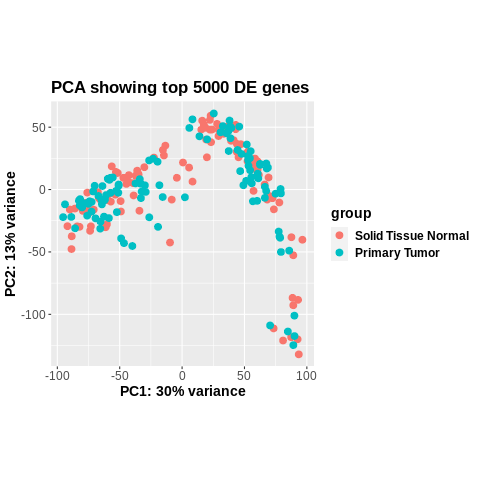
This worked fine a week ago (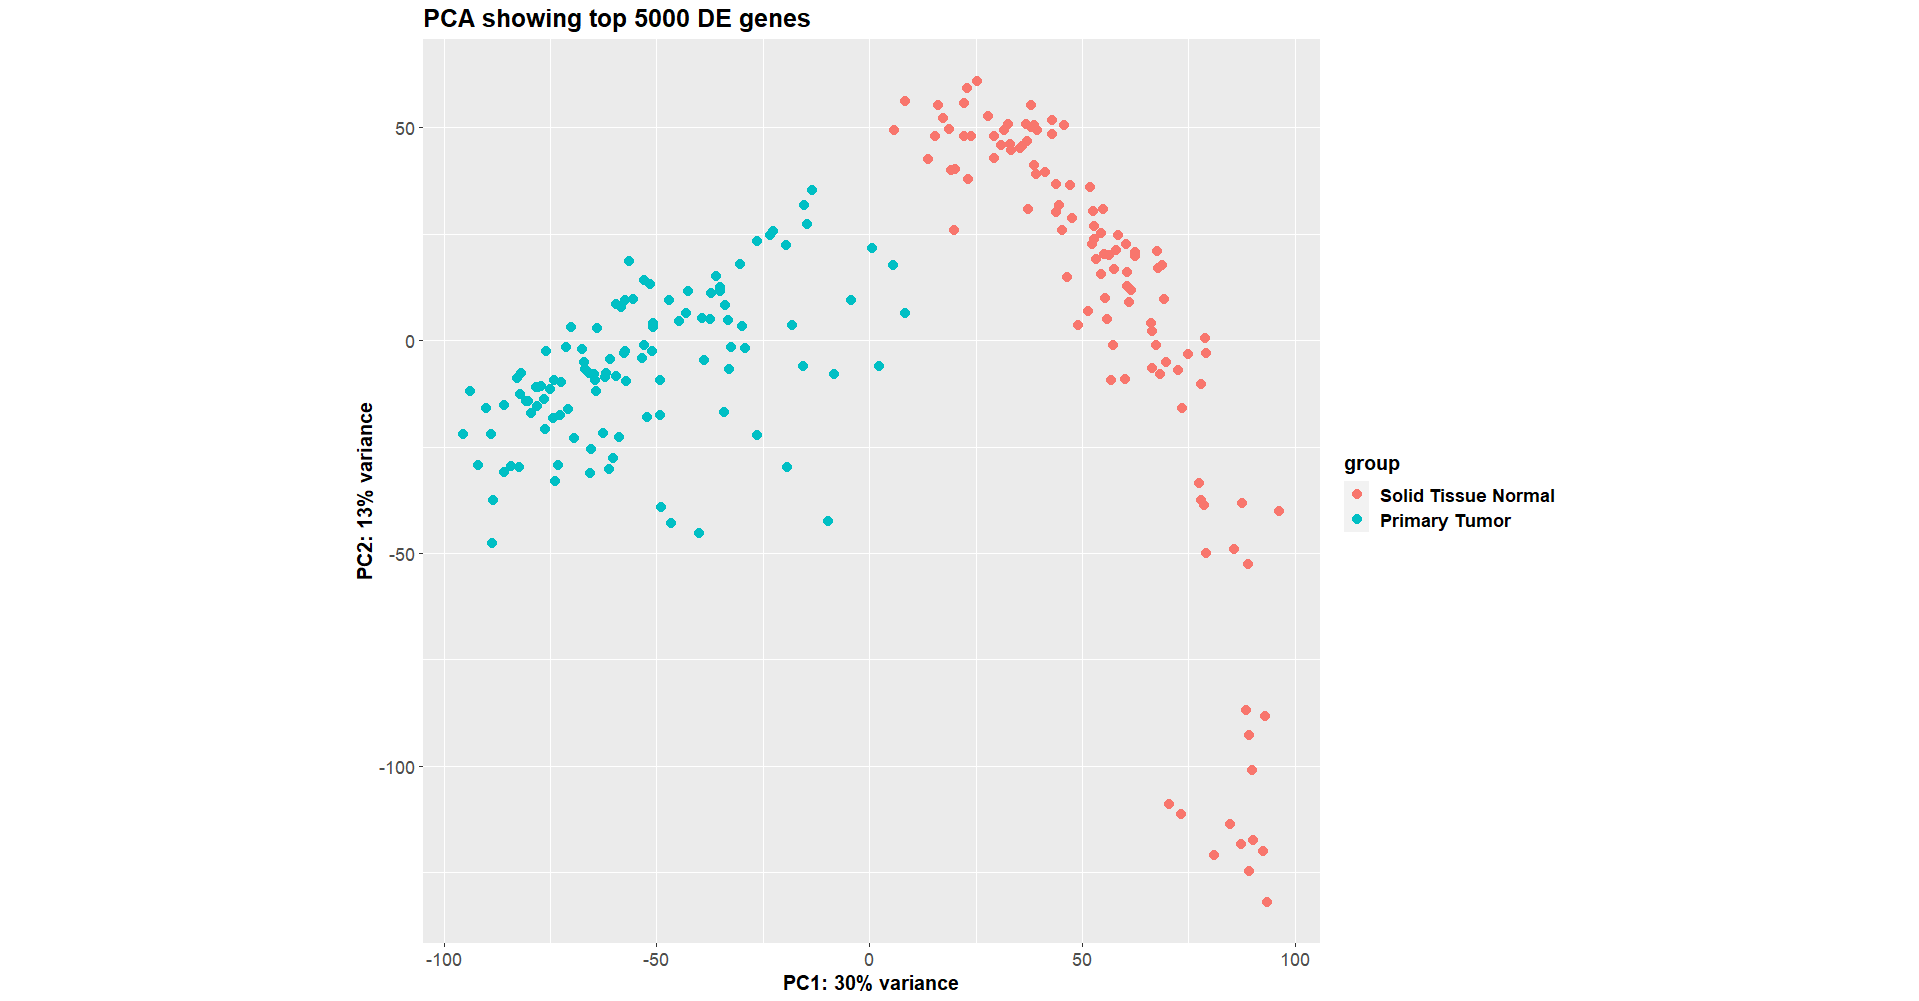
Luckily, I saved the dds object that I made a week ago, so I compared the new one vs the old one, and they are identical in terms of the samples and genes used to construct colData and countData, as well as the vst assays after DESeq2 has run.
i.e.
#all samples are the same
all(dds.old$sample %in% dds.new$sample) #TRUE

assay.old <- assay(vst.old)
assay.new <- assay(vst.new)

#gene count transformations done by DESeq2 are the same
identical (assay.old, assay.new) #TRUE

#all size factors are the same
all(sizeFactors(dds.old) == sizeFactors(dds.new)) #TRUE


# but Mu, Cooks distance, and dispersions are not the same somehow
identical(assays(dds.old)[["mu"]],assays(dds.new)[["mu"]]) #FALSE

identical(assays(dds.old)[["cooks"]],assays(dds.new)[["cooks"]]) #FALSE

identical(dispersions(dds.new),dispersions(dds.old)) #FALSE
So it seems the input values are the same, but the inner workings of DESeq2 was maybe different this time?
Another strange thing, is that the results from the two runs are very different. In the old run, some of the genes had p-adjusted values of < 0.05, whereas many of the new run's p-adjusted values were close to 1.
Example of the first few genes shown below:
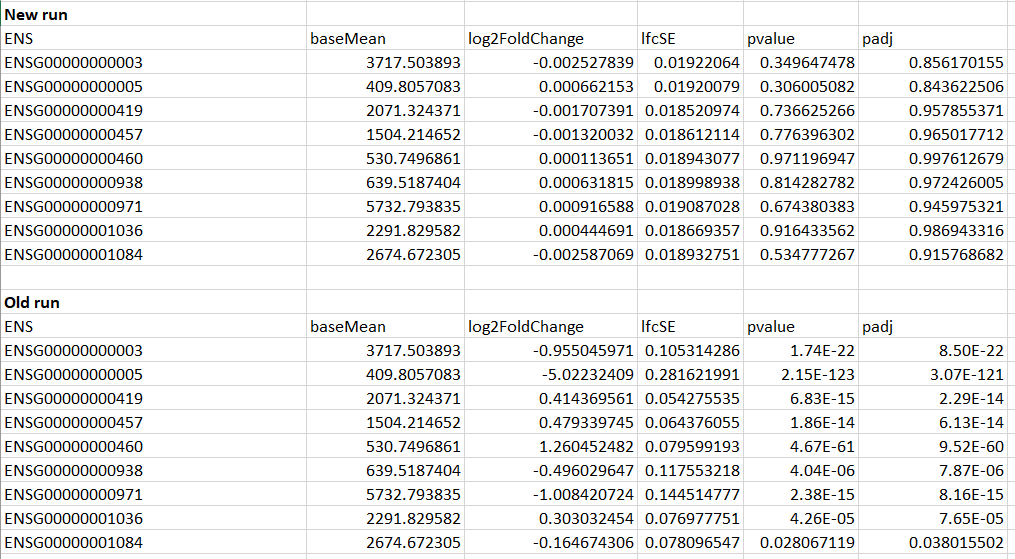
As you can see here, the basemean values are the same, but somehow the LFC and p's are way different...
I didn't update my version of R or of DESEq2. I was wondering whether anyone could help me out?
R version 4.2.0 (2022-04-22 ucrt)
Platform: x86_64-w64-mingw32/x64 (64-bit)
Running under: Windows 10 x64 (build 19044)

Matrix products: default

locale:
[1] LC_COLLATE=English_United Kingdom.utf8  LC_CTYPE=English_United Kingdom.utf8
[3] LC_MONETARY=English_United Kingdom.utf8 LC_NUMERIC=C
[5] LC_TIME=English_United Kingdom.utf8

attached base packages:
[1] stats4    stats     graphics  grDevices utils     datasets  methods   base

other attached packages:
 [1] DescTools_0.99.45           readr_2.1.2                 readxl_1.4.0
 [4] EnhancedVolcano_1.14.0      ggrepel_0.9.1               apeglm_1.18.0
 [7] dplyr_1.0.9                 org.Hs.eg.db_3.15.0         AnnotationDbi_1.58.0
[10] ggplot2_3.3.6               RColorBrewer_1.1-3          pheatmap_1.0.12
[13] tibble_3.1.8                biomaRt_2.52.0              DESeq2_1.36.0
[16] SummarizedExperiment_1.26.1 Biobase_2.56.0              MatrixGenerics_1.8.1
[19] matrixStats_0.62.0          GenomicRanges_1.48.0        GenomeInfoDb_1.32.2
[22] IRanges_2.30.0              S4Vectors_0.34.0            BiocGenerics_0.42.0

loaded via a namespace (and not attached):
 [1] colorspace_2.0-3       ellipsis_0.3.2         class_7.3-20           XVector_0.36.0
 [5] gld_2.6.5              rstudioapi_0.13        proxy_0.4-27           farver_2.1.1
 [9] bit64_4.0.5            fansi_1.0.3            mvtnorm_1.1-3          xml2_1.3.3
[13] codetools_0.2-18       splines_4.2.0          cachem_1.0.6           rootSolve_1.8.2.3
[17] geneplotter_1.74.0     annotate_1.74.0        dbplyr_2.2.1           png_0.1-7
[21] compiler_4.2.0         httr_1.4.3             assertthat_0.2.1       Matrix_1.4-1
[25] fastmap_1.1.0          cli_3.3.0              prettyunits_1.1.1      tools_4.2.0
[29] coda_0.19-4            gtable_0.3.0           glue_1.6.2             lmom_2.9
[33] GenomeInfoDbData_1.2.8 rappdirs_0.3.3         Rcpp_1.0.9             bbmle_1.0.25
[37] cellranger_1.1.0       vctrs_0.4.1            Biostrings_2.64.0      stringr_1.4.0
[41] lifecycle_1.0.1        XML_3.99-0.10          zlibbioc_1.42.0        MASS_7.3-58.1
[45] scales_1.2.0           vroom_1.5.7            hms_1.1.1              parallel_4.2.0
[49] expm_0.999-6           curl_4.3.2             Exact_3.1              memoise_2.0.1
[53] emdbook_1.3.12         bdsmatrix_1.3-6        stringi_1.7.8          RSQLite_2.2.15
[57] genefilter_1.78.0      e1071_1.7-11           filelock_1.0.2         boot_1.3-28
[61] BiocParallel_1.30.3    rlang_1.0.4            pkgconfig_2.0.3        bitops_1.0-7
[65] lattice_0.20-45        purrr_0.3.4            labeling_0.4.2         bit_4.0.4
[69] tidyselect_1.1.2       plyr_1.8.7             magrittr_2.0.3         R6_2.5.1
[73] generics_0.1.3         DelayedArray_0.22.0    DBI_1.1.3              pillar_1.8.0
[77] withr_2.5.0            survival_3.3-1         KEGGREST_1.36.3        RCurl_1.98-1.8
[81] crayon_1.5.1           utf8_1.2.2             BiocFileCache_2.4.0    tzdb_0.3.0
[85] progress_1.2.2         locfit_1.5-9.6         grid_4.2.0             data.table_1.14.2
[89] blob_1.2.3             digest_0.6.29          xtable_1.8-4           numDeriv_2016.8-1.1
[93] munsell_0.5.0
Thanks! Mia

Seconding this. The plot is even the same when it comes to coordinates of the points, something (on you to find out) altered colData. It is not a DESeq2 problem.