color scale ggcyto::autoplot
1
0
Entering edit mode
alex • 0
@222f89de
Last seen 16 months ago
Germany

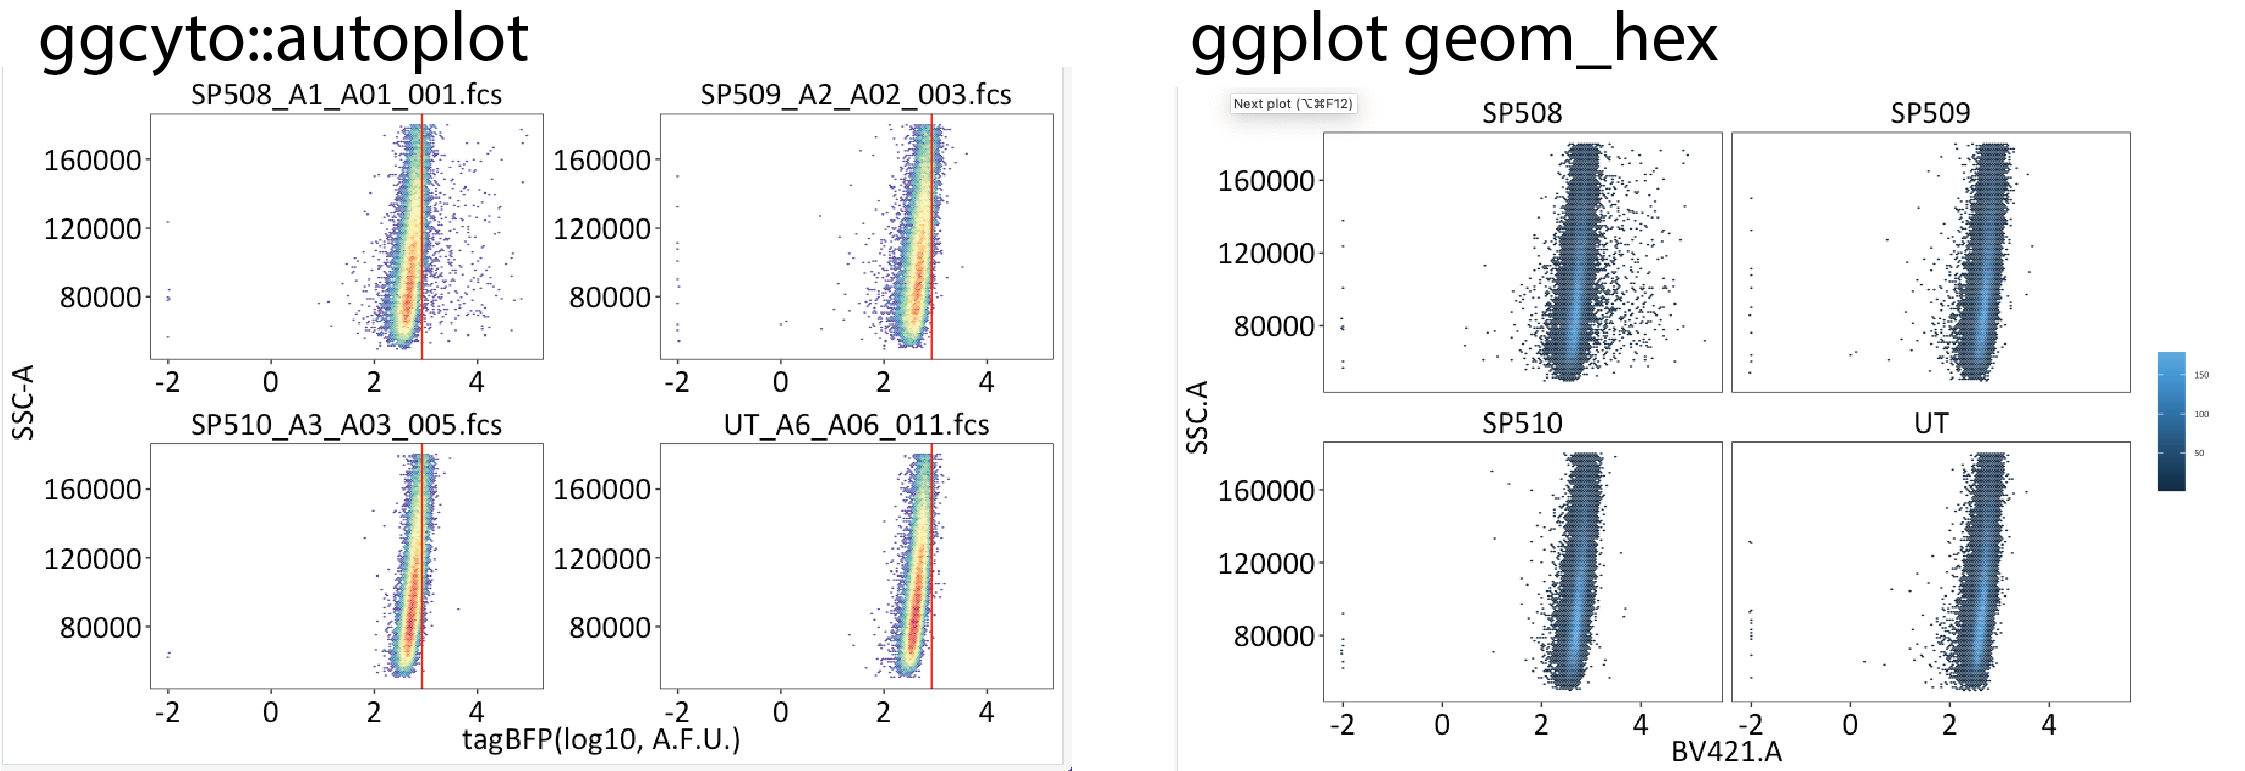
Hello everyone. I'm currently trying to recreate a plot I've done before with ggcyto::autoplot, this time doing with ggplot. So far,

ggplot(BFP_DF, aes(x=BV421.A, y=SSC.A)) + geom_hex(bins = 128) + facet_wrap(~Cell_line)

results in the same plot except for the coloring. Does anyone know what color gradient the autoplot function of ggcyto is based on?

See here for comparison : enter image description here

ggcyto • 974 views
ADD COMMENT
0
Entering edit mode
Kevin Blighe ★ 3.9k
@kevin
Last seen 8 weeks ago
Republic of Ireland

Hi alex,

I am fairly sure that you can obtain that colour scheme by adding this function to your ggplot object:

scale_colour_gradientn(colours = brewer.pal(n = 8,name = 'PiYG'), trans = 'sqrt')

Kevin

ADD COMMENT
0
Entering edit mode

Hi Kevin, thanks for the reply. Unfortunately, I get the same plot as before when trying:

ggplot(BFP_DF, aes(x=BV421.A, y=SSC.A)) + geom_hex(bins = 128) + facet_wrap(~Cell_line) +
  scale_colour_gradientn(colours = brewer.pal(n = 8,name = 'PiYG'), trans = 'sqrt')

Best, Alex

ADD REPLY

Login before adding your answer.

Traffic: 806 users visited in the last hour
Help About
FAQ
Access RSS
API
Stats

Use of this site constitutes acceptance of our User Agreement and Privacy Policy.

Powered by the version 2.3.6