No differentially expressed genes after DESeq
1
0
Entering edit mode
Zach • 0
@18084af8
Last seen 16 months ago
United States

Hello! I'm trying to do DGE on a small subset of data before importing and analyzing the rest. I'm new to R, and very new to DESeq2 (first time). I've been following the vignettes and tutorials as best I can. I've been able to do "analysis" on my subset (2 controls and 2 treatments) without errors finally. However, upon analyzing the results there are 0 genes listed of interest. 
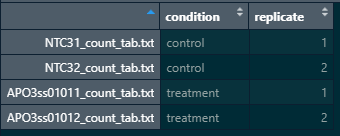
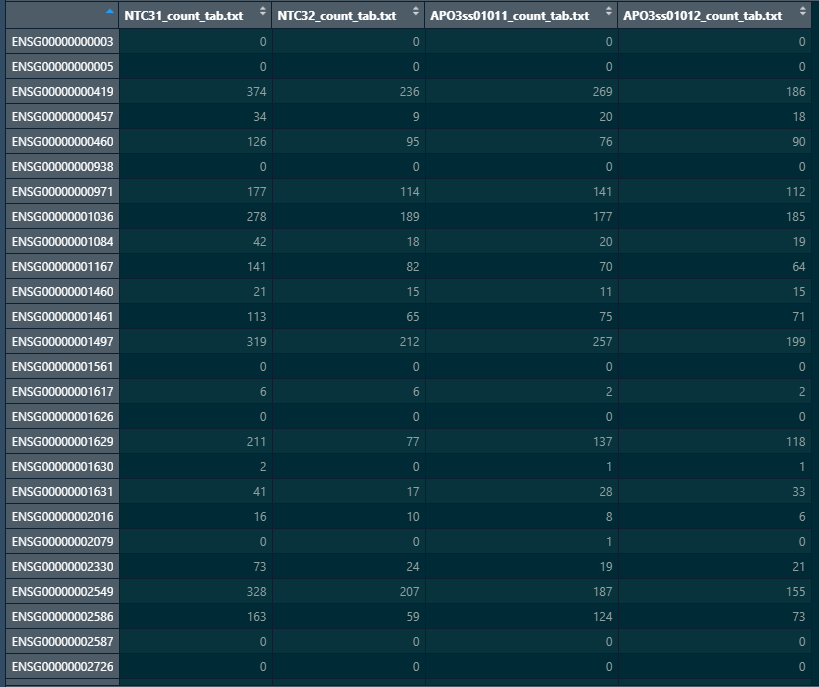
Here is a snapshot of my colData and count matrix colData count matrix

#matching coldata names with count matrix names
all(rownames(coldata_sample_simple) %in% colnames(simple_count))
[1] TRUE

#adding reference factor to base comparison on
dds$condition <- relevel(dds$condition, ref = "control")

#creating DESeq dataset object
dds_simple <- DESeqDataSetFromMatrix(countData = simple_count,
                              colData = coldata_sample_simple,
                              design = ~ condition)
dds_simple
class: DESeqDataSet 
dim: 58740 4 
metadata(1): version
assays(1): counts
rownames(58740): ENSG00000000003 ENSG00000000005 ... __not_aligned
  __alignment_not_unique
rowData names(0):
colnames(4): NTC31_count_tab.txt NTC32_count_tab.txt APO3ss01011_count_tab.txt
  APO3ss01012_count_tab.txt
colData names(2): condition replicate

summary(res_simple)
out of 19900 with nonzero total read count
adjusted p-value < 0.1
LFC > 0 (up)       : 0, 0%
LFC < 0 (down)     : 0, 0%
outliers [1]       : 0, 0%
low counts [2]     : 0, 0%
(mean count < 0)
[1] see 'cooksCutoff' argument of ?results
[2] see 'independentFiltering' argument of ?results

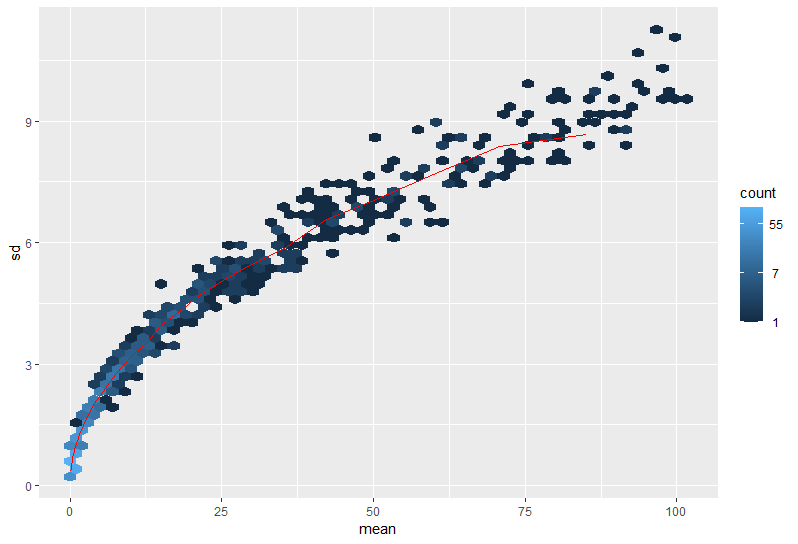
Here are a couple images of my data (from suggested analyses)

sessionInfo( )

MAplot SdMeanplot

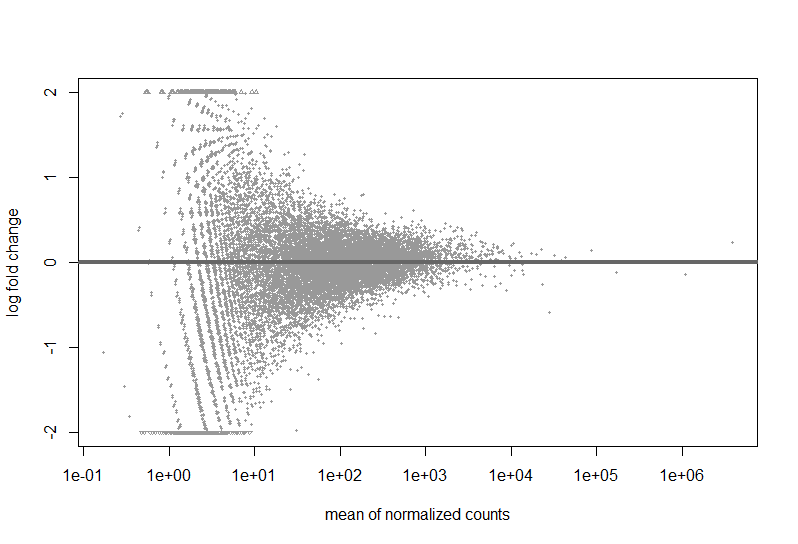
Just looking at the MAplot, I feel like there should be something that is differentially expressed. Do I need more samples to be able to make conclusions?

There are a tremendous amout of 'alignment not unqiue' reads. Would this contribute?

res_simple
log2 fold change (MLE): condition treatment vs control 
Wald test p-value: condition treatment vs control 
DataFrame with 58740 rows and 6 columns
                        baseMean log2FoldChange     lfcSE      stat    pvalue      padj
                       <numeric>      <numeric> <numeric> <numeric> <numeric> <numeric>
ENSG00000000003           0.0000             NA        NA        NA        NA        NA
ENSG00000000005           0.0000             NA        NA        NA        NA        NA
ENSG00000000419         258.0545      -0.110980  0.275095 -0.403425  0.686636  0.999944
ENSG00000000457          18.8728       0.264714  0.777033  0.340673  0.733350  0.999944
ENSG00000000460          95.2979      -0.122565  0.378462 -0.323851  0.746051  0.999944
...                          ...            ...       ...       ...       ...       ...
__no_feature             1101333      -0.136970  0.163765 -0.836385  0.402938  0.999944
__ambiguous               169735      -0.115875  0.167525 -0.691687  0.489134  0.999944
__too_low_aQual                0             NA        NA        NA        NA        NA
__not_aligned                  0             NA        NA        NA        NA        NA
__alignment_not_unique   3887524       0.232354  0.229656  1.011747  0.311659  0.999944

sum(res_simple$baseMean, na.rm=TRUE)
[1] 7969418

Thank you so much for taking the time and for any help!

DESeq2 R • 1.4k views
ADD COMMENT
0
Entering edit mode

I'd remove any of those "meta" features from the data.

## drop features starting with "__"
idx_metafeature <- stringr::str_detect(rownames(simple_count), "^__")
simple_count <- simple_count[!idx_metafeature,]

Also, the summary shown in question looks like it was run before running the testing procedure, i.e.,

## this runs the testing procedure
dds_simple <- DESeq(dds_simple)

## now check summary
summary(dds_simple)

## extract results table
res <- results(dds_simple)
ADD REPLY
0
Entering edit mode

Hi merv, Thanks so much for the advice and reply. I removed the metafeatures as suggested. I also re-ran the test and summary commands. Here is the output.

> dds_simple <- DESeq(dds_simple)
estimating size factors
estimating dispersions
gene-wise dispersion estimates
mean-dispersion relationship
final dispersion estimates
fitting model and testing
> summary(dds_simple)
[1] "DESeqDataSet object of length 58740 with 22 metadata columns"
> res <- results(dds_simple)
> summary(res)

out of 19900 with nonzero total read count
adjusted p-value < 0.1
LFC > 0 (up)       : 0, 0%
LFC < 0 (down)     : 0, 0%
outliers [1]       : 0, 0%
low counts [2]     : 0, 0%
(mean count < 0)
[1] see 'cooksCutoff' argument of ?results
[2] see 'independentFiltering' argument of ?results

> tail(simple_count)
                NTC31_count_tab.txt NTC32_count_tab.txt APO3ss01011_count_tab.txt
ENSG00000285989                   0                   0                         0
ENSG00000285990                   0                   0                         0
ENSG00000285991                   0                   0                         0
ENSG00000285992                   0                   0                         0
ENSG00000285993                   0                   0                         0
ENSG00000285994                   0                   0                         0
                APO3ss01012_count_tab.txt
ENSG00000285989                         0
ENSG00000285990                         0
ENSG00000285991                         0
ENSG00000285992                         0
ENSG00000285993                         0
ENSG00000285994                         0
>
ADD REPLY
0
Entering edit mode

You simply have no DEGs at that sample size, your study is likely underpowered. The MA-plot suggests that based on the logFCs there are genes basically eligable to be DE but it's not significant at FDR<0.1. You need more samples. Check the PCA (plotPCA()), see vignette, to see whether batch effects play a role.

ADD REPLY
0
Entering edit mode

Thanks for the reply ATpoint, Okay, I will, thanks!

ADD REPLY
0
Entering edit mode
swbarnes2 ★ 1.3k
@swbarnes2-14086
Last seen 15 hours ago
San Diego

Looking at your MA plot, it looks like once you have genes with decent count numbers, say, > 10, the predicted log fold changes drop to rather close to zero.

My MAplots looks much more like, well, X-wing profiles. There are dots across the very tops and bottoms of the graph going forward to the right to where the mean counts are > 100.

As ATPoint said, if the differences caused by your treatment are small, you need more power to be sure they are real. If you literally only have 2 control and 2 treatment, you could be missing real, but small differences. (Or, you have to admit the possibility that your treatment doesn't do anything, at least under the conditions which you tested it in.)

ADD COMMENT
0
Entering edit mode

Hi swbarnes,

Thanks for the reply! Understood. The point is well taken, with so few samples, I cannot conclude much with statistical power. I have since imported the remaining ~70 treatments into R and am analyzing them now. Something I hadn't done yet was to contrast specific groups against each other, that may give me some confidence in conclusions as well. I was worried I was doing the analysis wrong, as I would have expected 5-10% differential expression just by chance alone. Thanks much for your advice and time.

ADD REPLY

Login before adding your answer.

Traffic: 725 users visited in the last hour
Help About
FAQ
Access RSS
API
Stats

Use of this site constitutes acceptance of our User Agreement and Privacy Policy.

Powered by the version 2.3.6