Heatmap with result DESeq analysis
1
0
Entering edit mode
Chiara • 0
@bced2b55
Last seen 18 months ago
Luxembourg

Hello! I am analyzing my RNA-seq data using the DESeq2 method. I am using the following code to plot the 50 most differentially expressed genes in my database, but in my biological triplicate, I have one sample that acts as an outlier in the expression of some genes but looks congruent with the expression of the other replicates when I consider a large number of genes. !In the pic you can see one of the biological replicates acting as an outlier. I noticed that these "outliers" are not considered significant in the results (not significant padj) so they just come out in the heatmap. I am wondering if it is possible to create an heatmap or other plots using the csv result file, generated after the command res <- result(dds). The csv file contains the genes ID, the baseMean, the log2FoldChange, the lfcSE, the stat, the pvalue and the padj. I would like to create a plot using, for example, the 50 genes with the lowest padj score. Could you please suggest if there is a code for this? Or a reference that explains how to plot the results?

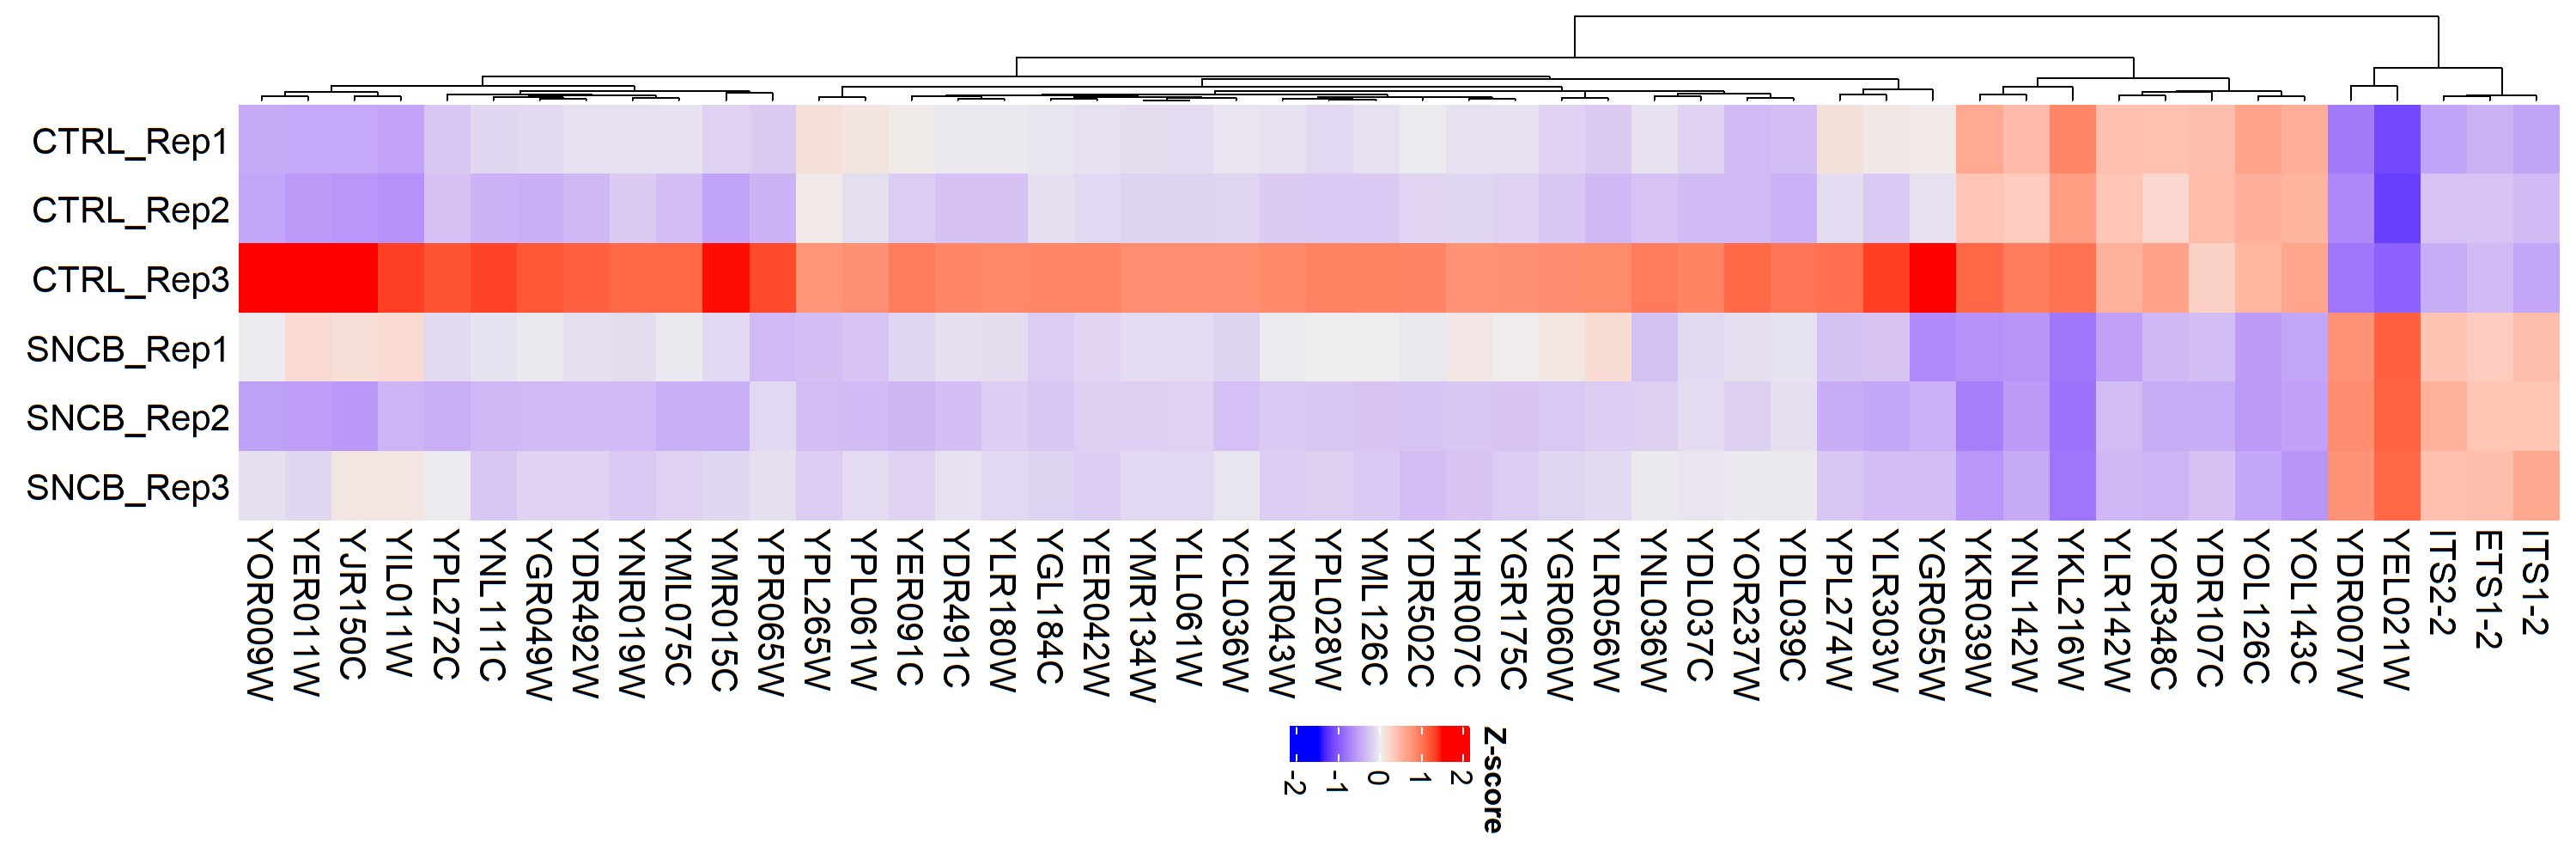
I apologize if my question is not correct or if I am not using the proper words, I started recently to use DESeq2 and I am not so proficient in coding, so I am a beginner in the RNAseq analysis.

Thank you for your time and your help.

Code should be placed in three backticks as shown below

```# select the 50 most differentially expressed genes topVarGenes <- head(order(rowVars(assay(rld)), decreasing = TRUE), 50)

mat <- assay(rld)[ topVarGenes, ] mat <- mat - rowMeans(mat) anno <- as.data.frame(mat)

library(ComplexHeatmap) library(ggplot2) f <- Heatmap(mat, cluster_rows = T, cluster_columns = F, column_labels = colnames(anno), name = "Z-score") png('Heatmap_1oo.png', res = 250, width = 1000, height = 3000) print(f) dev.off()

```

DESeq2 results Heatmaps plots • 2.0k views
ADD COMMENT
0
Entering edit mode
@mikelove
Last seen 11 hours ago
United States

For me the point of a heatmap is to show exactly this kind of sample variation and I don’t recommend using it just to show the information in the results table.

ADD COMMENT

Login before adding your answer.

Traffic: 936 users visited in the last hour
Help About
FAQ
Access RSS
API
Stats

Use of this site constitutes acceptance of our User Agreement and Privacy Policy.

Powered by the version 2.3.6