Entering edit mode

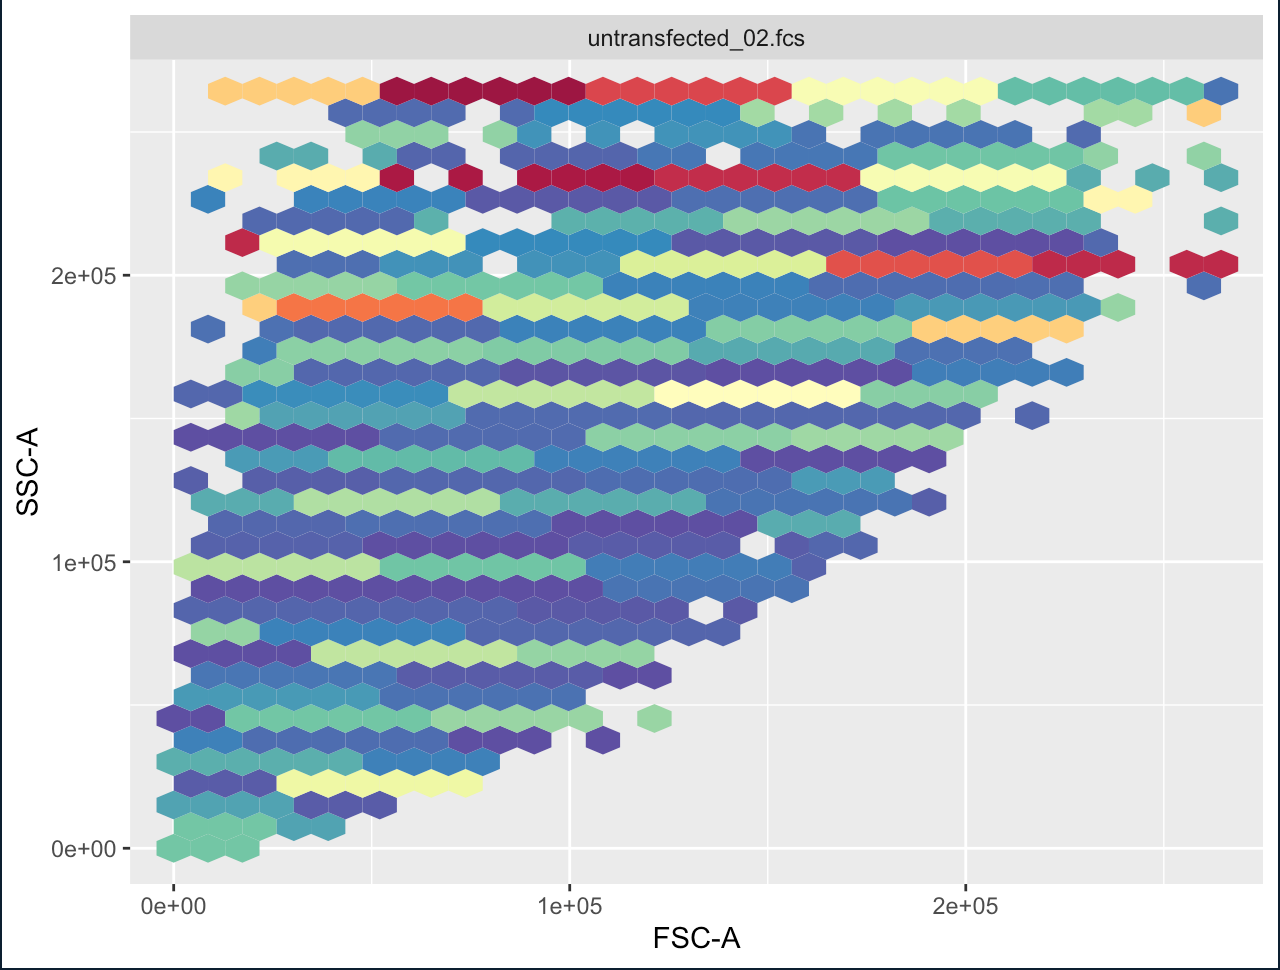
I was running a code for FACS analysis for a while but with recently updating R the heat map under the autoplot function seems to be disordered and I am unable to find the issue. Any downstream functions such as gating seem to work. I was also trying to reinstall a former version of R and reinstalling packages but it's still not fixable. The data is a set I was using before that worked.
if (!require("BiocManager", quietly = TRUE))
  install.packages("BiocManager")

BiocManager::install("flowCore")
BiocManager::install("openCyto")
BiocManager::install("ggcyto")

library (flowCore)
library (openCyto)
library (ggcyto)
library(tidyverse)

# Import Data and look at Names and col names

flowset <- read.flowSet(path='~/Documents/Uni/Master/CRISPR/Methods_module/FACS')
sampleNames(flowset)
colnames(flowset)

autoplot(flowset[[13]], x="FSC-A", y="SSC-A")

----------------------

> flowset <- read.flowSet(path='~/Documents/Uni/Master/CRISPR/Methods_module/FACS')
> sampleNames(flowset)
 [1] "Realuntransfected_0.fcs" "sgACT_R1.fcs"            "sgACT_R2.fcs"
 [4] "sgACT_R3.fcs"            "sgLIB_0.fcs"             "sgNT_R1.fcs"
 [7] "sgNT_R2.fcs"             "sgNT_R3.fcs"             "sgREP_R1.fcs"
[10] "sgREP_R2.fcs"            "sgREP_R3.fcs"            "untransfected_01.fcs"
[13] "untransfected_02.fcs"    "untransfected_03.fcs"    "untransfected_04.fcs"
> colnames(flowset)
[1] "FSC-A"       "FSC-H"       "FSC-W"       "SSC-A"       "SSC-H"       "SSC-W"
[7] "b-530/30-A"  "yg-610/20-A" "Time"
> # Plot FSC and 55C
> autoplot(flowset[[13]], x="FSC-A", y="SSC-A")
> flowset <- read.flowSet(path='~/Documents/Uni/Master/CRISPR/Methods_module/FACS')
> sampleNames(flowset)
 [1] "Realuntransfected_0.fcs" "sgACT_R1.fcs"            "sgACT_R2.fcs"
 [4] "sgACT_R3.fcs"            "sgLIB_0.fcs"             "sgNT_R1.fcs"
 [7] "sgNT_R2.fcs"             "sgNT_R3.fcs"             "sgREP_R1.fcs"
[10] "sgREP_R2.fcs"            "sgREP_R3.fcs"            "untransfected_01.fcs"
[13] "untransfected_02.fcs"    "untransfected_03.fcs"    "untransfected_04.fcs"
> colnames(flowset)
[1] "FSC-A"       "FSC-H"       "FSC-W"       "SSC-A"       "SSC-H"       "SSC-W"
[7] "b-530/30-A"  "yg-610/20-A" "Time"
>
> # Plot FSC and 55C
> autoplot(flowset[[13]], x="FSC-A", y="SSC-A")