Higher Dimensional RNASeq Clustering Significance
2
0
Entering edit mode
James • 0
@73ef4518
Last seen 16 months ago
United States

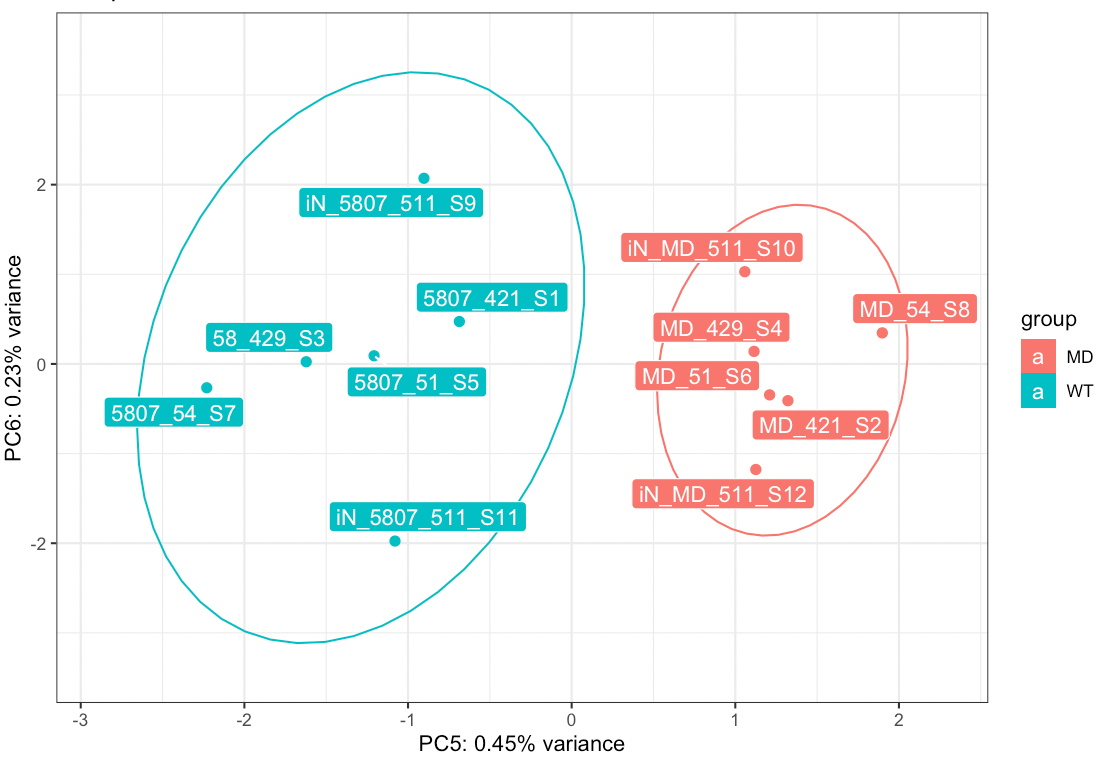
Looking at the principal components of our RNASeq data, there is clear separation between the diseased and controlled, however, this separation is in the 5th principal component, which only accounts for 0.45% of variance. There is no clear separation in the lower dimensions, which mostly show batch separation.

How can I statistically leverage the genes associated with this PC when they aren't differentially expressed in DESeq2? I've attached an image of the plot. 5th and 6th PC of RNASeq data

DESeq2 RNASeq PrincipalComponent pcaExplorer • 728 views
ADD COMMENT
0
Entering edit mode

You could perform GO on the genes that contribute the most to the variation along PC5, but indeed there is very very small difference between disease and control samples. Have you tried to perform a GSEA ?

ADD REPLY
0
Entering edit mode
@james-w-macdonald-5106
Last seen 14 hours ago
United States

The conventional answer is to adjust for the batch and other unobserved variability in the linear model using e.g., a batch factor and likely additional surrogate variables (using svaseq from the sva package), presuming that batch is orthogonal to your variable of interest.

ADD COMMENT
0
Entering edit mode
@f1c1bda2
Last seen 17 months ago
Vietnam

A GO analysis could be run on the genes responsible for the majority of the PC5 variation, but the truth is that there is barely any difference between diseased and healthy samples. basketball stars

ADD COMMENT

Login before adding your answer.

Traffic: 827 users visited in the last hour
Help About
FAQ
Access RSS
API
Stats

Use of this site constitutes acceptance of our User Agreement and Privacy Policy.

Powered by the version 2.3.6